Looker และ LookML ปี 2026: คู่มือ Business Intelligence และคำถามสัมภาษณ์
คู่มือ LookML ฉบับสมบูรณ์สำหรับ data analyst ในปี 2026 เรียนรู้ semantic layer การสร้างโมเดลข้อมูล derived tables และคำถามสัมภาษณ์ Looker ที่พบบ่อย
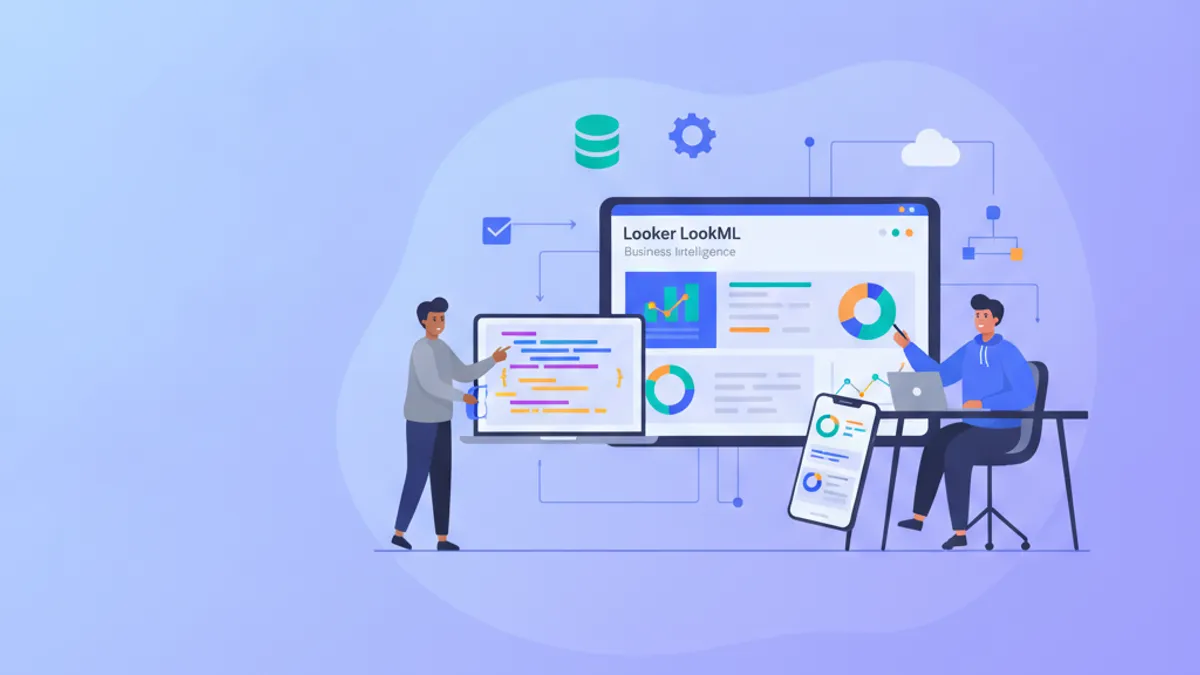
คำถามสัมภาษณ์ Looker มักมุ่งเน้นไปที่การสร้างโมเดล LookML กระบวนการสำรวจข้อมูล และวิธีที่ semantic layer แปลงตรรกะทางธุรกิจให้เป็นนิยามที่สามารถนำกลับมาใช้ใหม่ได้ คู่มือนี้ครอบคลุมแนวคิดหลักของ LookML รูปแบบการใช้งานจริง และคำถามที่ data analyst ต้องเผชิญเมื่อสัมภาษณ์สำหรับตำแหน่งที่เน้น Looker ในปี 2026
LookML แยกการสร้างโมเดลข้อมูลออกจากการสำรวจข้อมูล นักวิเคราะห์กำหนด dimensions measures และ relationships ครั้งเดียวใน model layer จากนั้นผู้ใช้ทางธุรกิจสามารถ query ข้อมูลได้โดยไม่ต้องเขียน SQL—รูปแบบนี้ปรากฏในการสัมภาษณ์ทางเทคนิค Looker เกือบทุกครั้ง
ทำความเข้าใจ Semantic Layer ของ LookML
LookML ทำหน้าที่เป็นชั้นการแปลระหว่างตารางฐานข้อมูลดิบและ metrics ที่เป็นมิตรกับธุรกิจ แทนที่จะเขียน SQL joins ที่ซับซ้อนซ้ำแล้วซ้ำเล่า นักวิเคราะห์กำหนด relationships ในไฟล์โมเดลที่ Looker คอมไพล์เป็น queries ที่ถูกปรับให้เหมาะสม
Semantic layer แก้ปัญหาสามประการที่ผู้สัมภาษณ์มักถามเกี่ยวกับ:
- ความสอดคล้อง: ผู้ใช้ทุกคนเห็นนิยาม metric เดียวกัน
- การนำกลับมาใช้ใหม่: Dimensions และ measures มีอยู่ครั้งเดียว อ้างอิงได้ทุกที่
- การกำกับดูแล: การเปลี่ยนแปลงแพร่กระจายโดยอัตโนมัติไปยัง dashboards ทั้งหมด
เอกสาร Looker ของ Google Cloud อธิบาย LookML ว่าเป็นภาษาที่ "dependency-aware"—เมื่อนิยามหนึ่งเปลี่ยนแปลง การอ้างอิง downstream จะอัปเดตโดยอัตโนมัติ ความสามารถในการรับรู้ dependency นี้กลายเป็นสิ่งสำคัญเมื่อดูแลโมเดลระดับองค์กร
Views และ Explores ของ LookML: องค์ประกอบพื้นฐาน
Views กำหนดคอลัมน์ที่มีจากตารางเดียวหรือ derived table Explores รวม views ผ่าน joins และแสดงให้ผู้ใช้ทางธุรกิจเห็น
# views/orders.view.lkml
view: orders {
  sql_table_name: `analytics.orders` ;;

  dimension: order_id {
    primary_key: yes
    type: number
    sql: ${TABLE}.order_id ;;
  }

  dimension_group: created {
    type: time
    timeframes: [raw, date, week, month, quarter, year]
    sql: ${TABLE}.created_at ;;
  }

  dimension: status {
    type: string
    sql: ${TABLE}.status ;;
  }

  measure: total_orders {
    type: count
    drill_fields: [order_id, created_date, status]
  }

  measure: total_revenue {
    type: sum
    sql: ${TABLE}.amount ;;
    value_format_name: usd
  }
}
การประกาศ dimension_group สร้าง dimensions หลายตัวตามเวลาจากคอลัมน์ timestamp เดียว ผู้สัมภาษณ์มักขอให้ผู้สมัครอธิบายว่าทำไมรูปแบบนี้ลดการทำซ้ำโค้ดและรับประกันการจัดการวันที่ที่สอดคล้องกันทั่วทั้งโมเดล
พารามิเตอร์ drill_fields กำหนดสิ่งที่ผู้ใช้เห็นเมื่อคลิกที่ค่า measure—รายละเอียด UX ที่แสดงถึงความเข้าใจว่านักวิเคราะห์โต้ตอบกับ Looker อย่างไรจริงๆ
Joins และ Relationships ใน LookML
Explores กำหนดวิธีที่ views เชื่อมต่อผ่าน SQL joins ประเภท join และการประกาศ relationship ส่งผลโดยตรงต่อประสิทธิภาพ query และความถูกต้องของ aggregation
# models/ecommerce.model.lkml
explore: orders {
  label: "Order Analysis"
  description: "All orders with customer and product details"

  join: customers {
    type: left_outer
    sql_on: ${orders.customer_id} = ${customers.customer_id} ;;
    relationship: many_to_one
  }

  join: order_items {
    type: left_outer
    sql_on: ${orders.order_id} = ${order_items.order_id} ;;
    relationship: one_to_many
  }

  join: products {
    type: left_outer
    sql_on: ${order_items.product_id} = ${products.product_id} ;;
    relationship: many_to_one
  }
}
พารามิเตอร์ relationship บอก Looker วิธีจัดการ aggregations Relationship one_to_many หมายความว่า measure ควร aggregate ที่ฝั่ง "one" เพื่อหลีกเลี่ยงการนับซ้ำ การทำผิดพลาดในเรื่องนี้ทำให้ยอดรวมไม่ถูกต้อง—สถานการณ์ debugging ที่พบบ่อยในการสัมภาษณ์
Symmetric aggregates แก้ปัญหา fanout โดยอัตโนมัติ เมื่อ join ตารางที่มี granularity ต่างกัน Looker สร้าง SQL ที่คำนวณ measures ที่ระดับที่ถูกต้องก่อนทำ join
Derived Tables สำหรับ Transformations ที่ซับซ้อน
Derived tables สร้างตารางเสมือนจาก SQL queries หรือ aggregations ที่กำหนดใน LookML Native derived tables ใช้ไวยากรณ์ LookML; SQL-derived tables ฝัง SQL ดิบ
# views/customer_order_facts.view.lkml
view: customer_order_facts {
  derived_table: {
    explore_source: orders {
      column: customer_id { field: customers.customer_id }
      column: first_order_date { field: orders.created_date }
      column: lifetime_orders { field: orders.total_orders }
      column: lifetime_revenue { field: orders.total_revenue }
      derived_column: customer_tenure_days {
        sql: DATE_DIFF(CURRENT_DATE(), first_order_date, DAY) ;;
      }
    }
    datagroup_trigger: daily_etl
    indexes: ["customer_id"]
  }

  dimension: customer_id {
    primary_key: yes
    hidden: yes
    type: number
  }

  dimension: first_order_date {
    type: date
    sql: ${TABLE}.first_order_date ;;
  }

  dimension: lifetime_orders {
    type: number
    sql: ${TABLE}.lifetime_orders ;;
  }

  dimension: customer_tier {
    type: string
    sql: CASE
      WHEN ${lifetime_orders} >= 10 THEN 'Gold'
      WHEN ${lifetime_orders} >= 5 THEN 'Silver'
      ELSE 'Bronze'
    END ;;
  }
}
datagroup_trigger ควบคุมเวลาที่ Looker สร้าง derived table ใหม่—โดยทั่วไปหลังจาก ETL upstream เสร็จสิ้น Persistent derived tables (PDTs) ถูก materialize ในฐานข้อมูล แลกพื้นที่จัดเก็บกับความเร็ว query
ผู้สัมภาษณ์ถามเกี่ยวกับกลยุทธ์ rebuild PDT พารามิเตอร์ sql_trigger_value รัน SQL query; เมื่อผลลัพธ์เปลี่ยน Looker จะสร้าง PDT ใหม่ รูปแบบที่พบบ่อยใช้ SELECT MAX(updated_at) FROM source_table
พร้อมที่จะพิชิตการสัมภาษณ์ Data Analytics แล้วหรือยังครับ?
ฝึกฝนด้วยตัวจำลองแบบโต้ตอบ, flashcards และแบบทดสอบเทคนิคครับ
คำถามสัมภาษณ์ Looker: การออกแบบโมเดล
การสัมภาษณ์ทางเทคนิคสำหรับตำแหน่ง Looker เน้นหนักที่การตัดสินใจเกี่ยวกับการสร้างโมเดล LookML คำถามเหล่านี้ประเมินว่าผู้สมัครเข้าใจ tradeoffs ระหว่างความยืดหยุ่นและประสิทธิภาพหรือไม่
คำถาม: จะสร้างโมเดล fact table ที่มีหลาย date dimensions ได้อย่างไร?
คำตอบเกี่ยวข้องกับการสร้าง dimension groups แยกกันและตั้งชื่อ joins อย่างชัดเจน:
# views/orders.view.lkml
view: orders {
  dimension_group: order_created {
    type: time
    timeframes: [date, week, month, year]
    sql: ${TABLE}.created_at ;;
  }

  dimension_group: order_shipped {
    type: time
    timeframes: [date, week, month, year]
    sql: ${TABLE}.shipped_at ;;
  }

  dimension: days_to_ship {
    type: number
    sql: DATE_DIFF(${order_shipped_date}, ${order_created_date}, DAY) ;;
  }
}
คำถาม: เมื่อใดควรใช้ PDT เทียบกับ dbt model?
PDTs เหมาะสำหรับ aggregations เฉพาะ Looker ที่เปลี่ยนแปลงตามโมเดล Transformations dbt เหมาะสำหรับ datasets ที่แชร์และใช้โดยหลาย tools รูปแบบ การรวม dbt + Looker ใช้ dbt สำหรับ transformations หนักและ PDTs สำหรับ metrics ขั้นสุดท้าย
คำถาม: จะจัดการ slowly changing dimensions ใน LookML ได้อย่างไร?
ตาราง SCD Type 2 ต้องการการกรองไปยัง record ปัจจุบัน เพิ่ม dimension ที่กรองแถวและใช้ always_filter ใน explore:
# views/customer_history.view.lkml
view: customer_history {
  dimension: is_current {
    type: yesno
    sql: ${TABLE}.end_date IS NULL ;;
  }
}

# In the explore
explore: orders {
  join: customer_history {
    sql_on: ${orders.customer_id} = ${customer_history.customer_id} ;;
    relationship: many_to_one
  }
  always_filter: {
    filters: [customer_history.is_current: "Yes"]
  }
}
Liquid Templating สำหรับโมเดลแบบไดนามิก
Liquid templating เปิดใช้งานตรรกะเงื่อนไขในนิยาม LookML User attributes ค่า filter และ permissions สามารถแก้ไข SQL ที่สร้างขึ้น
# views/regional_orders.view.lkml
view: regional_orders {
  sql_table_name:
    {% if _user_attributes['region'] == 'EMEA' %}
      analytics.orders_emea
    {% elsif _user_attributes['region'] == 'APAC' %}
      analytics.orders_apac
    {% else %}
      analytics.orders_us
    {% endif %}
  ;;

  dimension: amount {
    type: number
    sql: ${TABLE}.amount ;;
    html:
      {% if value > 1000 %}
        <span style="color: green;">{{ rendered_value }}</span>
      {% else %}
        {{ rendered_value }}
      {% endif %}
    ;;
  }
}
User attributes ขับเคลื่อน row-level security และการเลือกตารางแบบไดนามิก Object _user_attributes ให้การเข้าถึงค่าที่กำหนดในแผงผู้ดูแลระบบ Looker
พารามิเตอร์ html ปรับแต่งวิธีการแสดงค่าในตารางและ visualizations—conditional formatting ที่ปรากฏบ่อยในโปรเจกต์ take-home สัมภาษณ์
รูปแบบการปรับประสิทธิภาพให้เหมาะสม
Looker สร้าง SQL จากนิยาม LookML การปรับให้เหมาะสมต้องเข้าใจทั้ง model layer และฐานข้อมูลพื้นฐาน
Aggregate awareness pre-compute aggregations ทั่วไปที่ระดับ grain ต่างๆ:
# views/orders.view.lkml
view: orders {
  aggregate_table: daily_orders {
    query: {
      dimensions: [created_date]
      measures: [total_orders, total_revenue]
    }
    materialization: {
      datagroup_trigger: daily_etl
    }
  }

  aggregate_table: monthly_orders {
    query: {
      dimensions: [created_month]
      measures: [total_orders, total_revenue]
    }
    materialization: {
      datagroup_trigger: daily_etl
    }
  }
}
Looker กำหนดเส้นทาง queries ไปยัง aggregate table ที่เล็กที่สุดที่ตอบสนองคำขอโดยอัตโนมัติ Query dashboard รายเดือนอ่านจาก monthly_orders แทนที่จะสแกน fact table ทั้งหมด
การตั้งค่าระดับ connection ส่งผลต่อประสิทธิภาพอย่างมีนัยสำคัญ การเชื่อมต่อ BigQuery ควรเปิดใช้งาน query caching และตั้งค่า timeouts ที่เหมาะสม พารามิเตอร์ max_connections ควบคุม concurrent query slots
สำหรับ data analyst ที่เตรียมตัวสัมภาษณ์ คู่มือ SQL window functions ครอบคลุม query patterns ที่เสริมทักษะการสร้างโมเดล LookML
Access Controls และ Content Management
Row-level security, model permissions และการจัดระเบียบเนื้อหาปรากฏในการสัมภาษณ์ Looker ระดับอาวุโส กลไก access_grant ควบคุมความพร้อมใช้งานของฟีเจอร์:
# models/ecommerce.model.lkml
access_grant: can_view_pii {
  user_attribute: department
  allowed_values: ["data_team", "compliance"]
}

explore: customers {
  access_filter: {
    field: customers.region
    user_attribute: allowed_regions
  }
}

view: customers {
  dimension: email {
    type: string
    sql: ${TABLE}.email ;;
    required_access_grants: [can_view_pii]
  }
}
access_filter เพิ่ม WHERE clauses แบบไดนามิกตาม user attributes ผู้จัดการฝ่ายขายเห็นเฉพาะข้อมูลของภูมิภาคตน พารามิเตอร์ required_access_grants ซ่อน dimensions จากผู้ใช้ที่ไม่มี grant ที่ระบุ
การจัดระเบียบเนื้อหาตาม hierarchy โฟลเดอร์ Dashboards production อยู่ใน shared spaces; งาน development อยู่ใน personal folders จนกว่าจะผ่านการตรวจสอบ LookML validator ตรวจจับข้อผิดพลาดไวยากรณ์ก่อน deployment
ข้อผิดพลาดในการสัมภาษณ์ที่พบบ่อยที่ควรหลีกเลี่ยง
การสัมภาษณ์ทางเทคนิค Looker เผยให้เห็นความเข้าใจผิดที่พบบ่อย:
การประกาศ relationship ที่ไม่ถูกต้อง ทำให้ metric พองตัว Relationship one_to_one บน join one_to_many สร้าง aggregates ที่ผิด ตรวจสอบ cardinality ด้วย queries SELECT COUNT(*), COUNT(DISTINCT key) เสมอ
พึ่งพา SQL-derived tables มากเกินไป แทน native derives Native derived tables รวมกับ dependency tracking ของ Looker; SQL-derived tables ต้องการการจัดการด้วยตนเอง
เพิกเฉย datagroup caching หากไม่มี cache invalidation ที่เหมาะสม dashboards จะแสดงข้อมูลเก่า กำหนด datagroups ที่สอดคล้องกับตาราง ETL และกำหนดให้ explores
สำหรับการเตรียมตัวสัมภาษณ์ที่ครอบคลุมเกี่ยวกับแนวคิดการสร้างโมเดลข้อมูลและ analytics คู่มือคำถามสัมภาษณ์ data analytics ครอบคลุมหัวข้อที่กว้างกว่าความรู้เฉพาะ Looker
สรุป
การประสบความสำเร็จในการสัมภาษณ์ Looker ต้องแสดงให้เห็นทั้งความรู้ไวยากรณ์ LookML และความเข้าใจว่าทำไมสถาปัตยกรรม semantic layer จึงเป็นประโยชน์ต่อองค์กร:
- LookML views กำหนด dimensions และ measures; explores รวม views ผ่าน joins ที่ประกาศด้วย relationship types ที่ชัดเจน
- Derived tables materialize transformations ที่ซับซ้อน; datagroups ควบคุม cache invalidation และตาราง rebuild PDT
- Liquid templating เปิดใช้งานการสร้าง SQL แบบไดนามิกตาม user attributes และการเลือก filter
- Aggregate awareness pre-compute metrics ที่หลาย grains กำหนดเส้นทาง queries ไปยังตารางที่เหมาะสมที่สุดโดยอัตโนมัติ
- Access controls รวม row-level filters, access grants และ content permissions สำหรับ governed self-service
- การปรับประสิทธิภาพให้เหมาะสมต้องจัดแนวรูปแบบ LookML กับการปรับแต่งเฉพาะฐานข้อมูล (BigQuery slots, Snowflake warehouses)
ฝึกสร้างโมเดล LookML กับ sample datasets ก่อนการสัมภาษณ์ BigQuery public datasets มี schemas ที่สมจริงสำหรับแบบฝึกหัดการสร้างโมเดล
เริ่มฝึกซ้อมเลย!
ทดสอบความรู้ของคุณด้วยตัวจำลองสัมภาษณ์และแบบทดสอบเทคนิคครับ
คุณหาบั๊กใน Data Analytics เจอไหม
โค้ดจริงหนึ่งชิ้น บั๊กที่ซ่อนอยู่หนึ่งจุด วันละหนึ่งครั้ง ลองได้โดยไม่ต้องมีบัญชี

เขียนโดย
Anthony Fillion-Mailletผู้ก่อตั้ง SharpSkill
เป็นนักพัฒนาฟูลสแตกมากว่า 10 ปี ดูแล SharpSkill และรับผิดชอบทุกสิ่งที่เผยแพร่ที่นี่
อัปเดตเมื่อ 20 กรกฎาคม 2569
แท็ก
แชร์
บทความที่เกี่ยวข้อง

Apache Superset ปี 2026: แดชบอร์ด SQL Lab และคำถามสัมภาษณ์
เจาะลึก Apache Superset: การสร้างแดชบอร์ดวิเคราะห์ข้อมูล SQL Lab และ Jinja templating การเปรียบเทียบกับ Tableau และคำถามสัมภาษณ์ที่สำคัญ
Pandas 3.0 ในปี 2026: API ใหม่, Breaking Changes และคำถามสัมภาษณ์งาน
คู่มือฉบับสมบูรณ์เกี่ยวกับ Pandas 3.0 ครอบคลุม Copy-on-Write, PyArrow string backend, pd.col() expressions, breaking changes และคำถามสัมภาษณ์ data analytics
dbt สำหรับ Data Analyst ในปี 2026: การสร้างโมเดล การทดสอบ และคำถามสัมภาษณ์งาน
เรียนรู้ dbt สำหรับ Data Analyst ตั้งแต่การสร้างโมเดล การทดสอบข้อมูล ไปจนถึงคำถามสัมภาษณ์งานที่พบบ่อย พร้อมตัวอย่างโค้ดและแนวปฏิบัติที่ดี