Spring Boot Actuator: การตรวจสอบบนโปรดักชันด้วย Micrometer และ Prometheus
คู่มือ Spring Boot Actuator ฉบับสมบูรณ์สำหรับการตรวจสอบบนโปรดักชัน ทั้งการตั้งค่า Micrometer, เมตริก Prometheus, endpoint ที่กำหนดเอง และการแจ้งเตือน
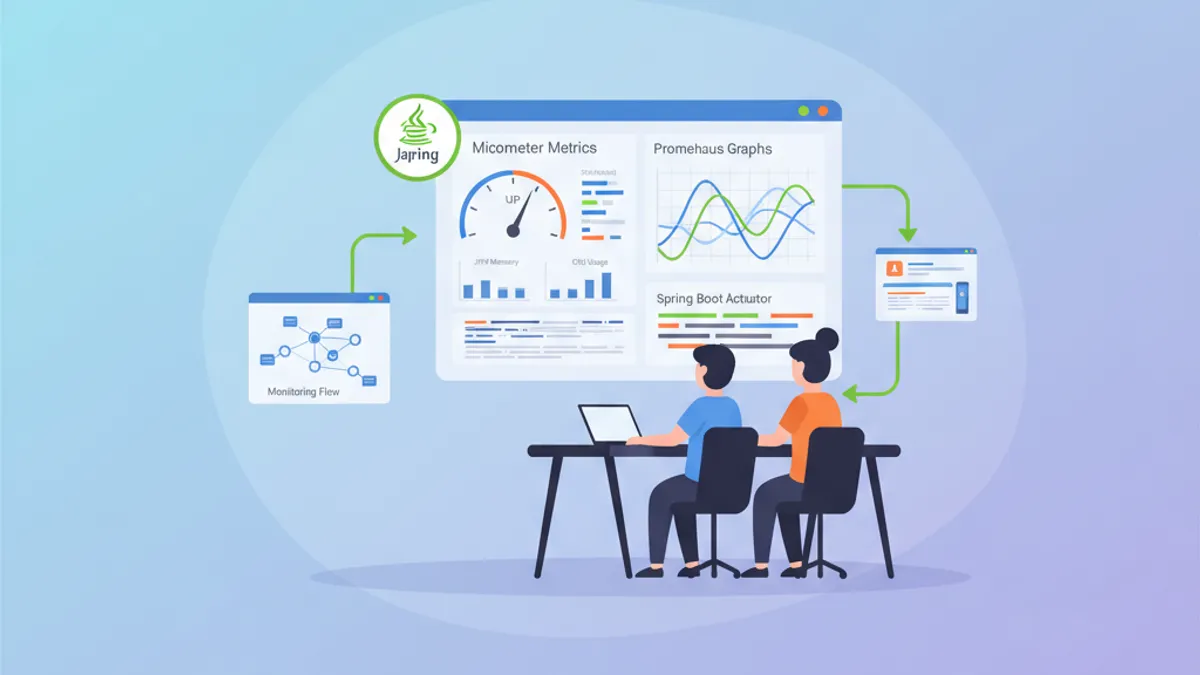
Spring Boot Actuator ช่วยพลิกโฉมการตรวจสอบแอปพลิเคชัน Java ด้วยการมอบ endpoint ที่พร้อมใช้งานบนโปรดักชันสำหรับ health check, เมตริก และการวินิจฉัยปัญหา เมื่อรวมกับ Micrometer และ Prometheus ก็จะกลายเป็นโซลูชันด้าน observability ที่ครบถ้วนสำหรับสภาพแวดล้อมโปรดักชัน
Actuator เปิดเผยเมตริกของ JVM และแอปพลิเคชันมากกว่า 50 รายการโดยอัตโนมัติโดยไม่ต้องตั้งค่าเพิ่มเติม Micrometer ทำหน้าที่เป็น facade ในการเผยแพร่เมตริกเหล่านี้ไปยัง Prometheus, Grafana, Datadog หรือระบบตรวจสอบใด ๆ ก็ได้
การตั้งค่าพื้นฐานกับ Spring Boot 3
Dependency Maven ที่ต้องใช้
การเชื่อม Actuator เข้ากับ Prometheus ต้องอาศัย dependency หลักสามตัว starter ของ Actuator เปิดใช้งาน endpoint ส่วน Micrometer ให้ชั้นนามธรรมของเมตริก และ registry ของ Prometheus จัดรูปแบบข้อมูลสำหรับการ scrape
<!-- pom.xml -->
<!-- Actuator + Micrometer + Prometheus Configuration -->
<dependencies>
    <!-- Spring Boot Actuator - monitoring endpoints -->
    <dependency>
        <groupId>org.springframework.boot</groupId>
        <artifactId>spring-boot-starter-actuator</artifactId>
    </dependency>

    <!-- Micrometer Registry Prometheus -->
    <!-- Exposes metrics in Prometheus format -->
    <dependency>
        <groupId>io.micrometer</groupId>
        <artifactId>micrometer-registry-prometheus</artifactId>
    </dependency>

    <!-- AOP for @Timed and @Counted metrics -->
    <dependency>
        <groupId>org.springframework.boot</groupId>
        <artifactId>spring-boot-starter-aop</artifactId>
    </dependency>
</dependencies>
Dependency เพียงเท่านี้ก็เพียงพอสำหรับเปิด endpoint /actuator/prometheus ให้ Prometheus เข้ามา scrape เป็นระยะ
การตั้งค่า Endpoint ของ Actuator
ค่าเริ่มต้นจะเปิดเฉพาะ endpoint health และ info ผ่าน HTTP เท่านั้น การกำหนดค่าอย่างชัดเจนจะควบคุมว่า endpoint ใดยังคงเข้าถึงได้ในโปรดักชัน
# application.yml
# Actuator configuration for production
management:
  endpoints:
    web:
      exposure:
        # Endpoints exposed over HTTP
        # health, info, prometheus are minimum for monitoring
        include: health,info,prometheus,metrics,env,loggers
      base-path: /actuator
    # Disable unused endpoints to reduce attack surface
    enabled-by-default: false
  endpoint:
    # Enable each required endpoint individually
    health:
      enabled: true
      show-details: when-authorized
      show-components: when-authorized
    info:
      enabled: true
    prometheus:
      enabled: true
    metrics:
      enabled: true
    env:
      enabled: true
      # Mask sensitive values
      show-values: when-authorized
    loggers:
      enabled: true
ตัวเลือก show-details: when-authorized จะแสดงรายละเอียดสุขภาพเฉพาะกับผู้ใช้ที่ผ่านการยืนยันตัวตนและมีบทบาทเหมาะสมเท่านั้น
// Securing Actuator endpoints
package com.example.monitoring.config;

import org.springframework.boot.actuate.autoconfigure.security.servlet.EndpointRequest;
import org.springframework.context.annotation.Bean;
import org.springframework.context.annotation.Configuration;
import org.springframework.security.config.annotation.web.builders.HttpSecurity;
import org.springframework.security.web.SecurityFilterChain;

@Configuration
public class ActuatorSecurityConfig {

    @Bean
    SecurityFilterChain actuatorSecurityFilterChain(HttpSecurity http) throws Exception {
        return http
            .securityMatcher(EndpointRequest.toAnyEndpoint())
            .authorizeHttpRequests(auth -> auth
                // Health and info public for load balancers
                .requestMatchers(EndpointRequest.to("health", "info")).permitAll()
                // Prometheus accessible from internal network
                .requestMatchers(EndpointRequest.to("prometheus")).hasIpAddress("10.0.0.0/8")
                // Other endpoints restricted to admins
                .anyRequest().hasRole("ACTUATOR_ADMIN")
            )
            .httpBasic(basic -> {})
            .build();
    }
}
การตั้งค่านี้เปิดให้สาธารณะเข้าถึง endpoint พื้นฐาน พร้อมกับปกป้อง endpoint ที่อ่อนไหวไปด้วย
เมตริกแบบกำหนดเองด้วย Micrometer
Counter และ Gauge ระดับแอปพลิเคชัน
Micrometer มีเมตริกหลายชนิดให้เลือกใช้ตามสถานการณ์ Counter วัดเหตุการณ์สะสม gauge วัดค่าชั่วขณะ ส่วน timer วัดระยะเวลาของการดำเนินการ
// Custom business metrics service
package com.example.monitoring.metrics;

import io.micrometer.core.instrument.Counter;
import io.micrometer.core.instrument.Gauge;
import io.micrometer.core.instrument.MeterRegistry;
import io.micrometer.core.instrument.Timer;
import org.springframework.stereotype.Service;

import java.util.concurrent.atomic.AtomicInteger;
import java.util.function.Supplier;

@Service
public class OrderMetricsService {

    // Counter for orders created with status tag
    private final Counter ordersCreatedCounter;
    // Timer to measure processing duration
    private final Timer orderProcessingTimer;
    // Atomic value for pending orders gauge
    private final AtomicInteger pendingOrdersCount = new AtomicInteger(0);

    public OrderMetricsService(MeterRegistry registry) {
        // Counter with tags for filtering in Prometheus
        this.ordersCreatedCounter = Counter.builder("orders.created.total")
            .description("Total number of orders created")
            .tag("application", "order-service")
            .register(registry);

        // Timer with histogram for percentiles
        this.orderProcessingTimer = Timer.builder("orders.processing.duration")
            .description("Order processing duration")
            .publishPercentiles(0.5, 0.95, 0.99)
            .publishPercentileHistogram()
            .register(registry);

        // Gauge linked to atomic value
        // Updates automatically on each scrape
        Gauge.builder("orders.pending.count", pendingOrdersCount, AtomicInteger::get)
            .description("Number of orders pending processing")
            .register(registry);
    }

    public void recordOrderCreated() {
        ordersCreatedCounter.increment();
        pendingOrdersCount.incrementAndGet();
    }

    public void recordOrderProcessed(Runnable processingLogic) {
        // Automatically measures execution duration
        orderProcessingTimer.record(processingLogic);
        pendingOrdersCount.decrementAndGet();
    }

    public <T> T recordOrderProcessedWithResult(Supplier<T> processingLogic) {
        return orderProcessingTimer.record(processingLogic);
    }
}
การใช้ tag ทำให้สามารถกรองและรวมเมตริกใน Prometheus ผ่านการคิวรี PromQL อย่างแม่นยำ
แอนโนเทชัน @Timed และ @Counted
เพื่อหลีกเลี่ยงโค้ดซ้ำซาก Micrometer มีแอนโนเทชัน AOP ที่ทำการ instrument เมธอดให้โดยอัตโนมัติ
// Automatic instrumentation with annotations
package com.example.monitoring.service;

import io.micrometer.core.annotation.Counted;
import io.micrometer.core.annotation.Timed;
import org.springframework.stereotype.Service;

@Service
public class PaymentService {

    // @Timed automatically creates a Timer
    // Measures each call and publishes count, sum, max
    @Timed(
        value = "payment.process.duration",
        description = "Payment processing duration",
        percentiles = {0.5, 0.95, 0.99},
        histogram = true
    )
    public PaymentResult processPayment(PaymentRequest request) {
        // Payment logic
        validatePayment(request);
        return executePayment(request);
    }

    // @Counted increments a counter on each call
    // Useful for discrete events
    @Counted(
        value = "payment.refunds.total",
        description = "Total number of refunds"
    )
    public void refundPayment(String transactionId) {
        // Refund logic
    }

    // Combining both annotations
    @Timed(value = "payment.validation.duration")
    @Counted(value = "payment.validation.total")
    private void validatePayment(PaymentRequest request) {
        // Payment validation
    }
}// Required configuration to enable @Timed
package com.example.monitoring.config;
import io.micrometer.core.aop.CountedAspect;
import io.micrometer.core.aop.TimedAspect;
import io.micrometer.core.instrument.MeterRegistry;
import org.springframework.context.annotation.Bean;
import org.springframework.context.annotation.Configuration;
@Configuration
public class TimedAspectConfig {
// Aspect required for @Timed to work
@Bean
TimedAspect timedAspect(MeterRegistry registry) {
return new TimedAspect(registry);
}
// Aspect for @Counted
@Bean
CountedAspect countedAspect(MeterRegistry registry) {
return new CountedAspect(registry);
}
}แอนโนเทชัน @Timed และ @Counted ใช้ได้เฉพาะกับ bean ของ Spring และการเรียกใช้งานจากภายนอกเท่านั้น การเรียกภายในคลาสเดียวกันจะข้าม proxy ของ AOP จึงไม่ถูก instrument
พร้อมที่จะพิชิตการสัมภาษณ์ Spring Boot แล้วหรือยังครับ?
ฝึกฝนด้วยตัวจำลองแบบโต้ตอบ, flashcards และแบบทดสอบเทคนิคครับ
Endpoint สุขภาพแบบกำหนดเอง
Health Indicator เชิงธุรกิจ
Health Indicator ตรวจสอบสถานะของบริการภายนอกและองค์ประกอบทางธุรกิจที่สำคัญ Spring Boot มี indicator มาตรฐานสำหรับฐานข้อมูล Redis และบริการที่พบบ่อยอื่น ๆ
// Health indicator for payment gateway
package com.example.monitoring.health;

import org.springframework.boot.actuate.health.Health;
import org.springframework.boot.actuate.health.HealthIndicator;
import org.springframework.stereotype.Component;
import org.springframework.web.client.RestClient;

import java.time.Duration;
import java.time.Instant;

@Component
public class PaymentGatewayHealthIndicator implements HealthIndicator {

    private final RestClient restClient;
    private final String gatewayHealthUrl;

    public PaymentGatewayHealthIndicator(RestClient.Builder restClientBuilder) {
        this.restClient = restClientBuilder.build();
        this.gatewayHealthUrl = "https://api.payment-gateway.com/health";
    }

    @Override
    public Health health() {
        Instant start = Instant.now();

        try {
            // Call gateway health endpoint
            var response = restClient.get()
                .uri(gatewayHealthUrl)
                .retrieve()
                .toBodilessEntity();

            Duration responseTime = Duration.between(start, Instant.now());

            if (response.getStatusCode().is2xxSuccessful()) {
                return Health.up()
                    .withDetail("responseTime", responseTime.toMillis() + "ms")
                    .withDetail("statusCode", response.getStatusCode().value())
                    .build();
            } else {
                return Health.down()
                    .withDetail("statusCode", response.getStatusCode().value())
                    .withDetail("reason", "Unexpected status code")
                    .build();
            }
        } catch (Exception e) {
            Duration responseTime = Duration.between(start, Instant.now());

            return Health.down()
                .withDetail("error", e.getClass().getSimpleName())
                .withDetail("message", e.getMessage())
                .withDetail("responseTime", responseTime.toMillis() + "ms")
                .build();
        }
    }
}
Indicator นี้จะปรากฏใน /actuator/health ภายใต้ชื่อ paymentGateway โดยอัตโนมัติ
กลุ่มสุขภาพสำหรับ Kubernetes
กลุ่มสุขภาพช่วยให้สร้าง endpoint แยกต่างหากสำหรับ probe liveness และ readiness ของ Kubernetes ได้
# application.yml
# Health groups configuration for Kubernetes
management:
  endpoint:
    health:
      group:
        # Liveness probe - is the application alive?
        liveness:
          include: livenessState
          show-details: always
        # Readiness probe - can the application receive traffic?
        readiness:
          include: readinessState,db,redis,paymentGateway
          show-details: always
        # Custom probe for critical dependencies
        critical:
          include: db,paymentGateway
          show-details: when-authorized
  health:
    # Enable Kubernetes states
    livenessstate:
      enabled: true
    readinessstate:
enabled: true// Programmatic health groups configuration
package com.example.monitoring.config;
import org.springframework.boot.actuate.availability.LivenessStateHealthIndicator;
import org.springframework.boot.actuate.availability.ReadinessStateHealthIndicator;
import org.springframework.boot.availability.ApplicationAvailability;
import org.springframework.context.annotation.Bean;
import org.springframework.context.annotation.Configuration;
@Configuration
public class KubernetesHealthConfig {
@Bean
LivenessStateHealthIndicator livenessStateHealthIndicator(
ApplicationAvailability availability) {
return new LivenessStateHealthIndicator(availability);
}
@Bean
ReadinessStateHealthIndicator readinessStateHealthIndicator(
ApplicationAvailability availability) {
return new ReadinessStateHealthIndicator(availability);
}
}จากนั้น probe ของ Kubernetes ก็ชี้ไปยัง endpoint เฉพาะได้:
# kubernetes-deployment.yml
# Kubernetes probes configuration
spec:
  containers:
    - name: order-service
      livenessProbe:
        httpGet:
          path: /actuator/health/liveness
          port: 8080
        initialDelaySeconds: 30
        periodSeconds: 10
        failureThreshold: 3
      readinessProbe:
        httpGet:
          path: /actuator/health/readiness
          port: 8080
        initialDelaySeconds: 10
        periodSeconds: 5
        failureThreshold: 3
การเชื่อมต่อกับ Prometheus และ Grafana
การตั้งค่า Scraping ของ Prometheus
Prometheus เก็บเมตริกโดยเรียกดู endpoint /actuator/prometheus เป็นระยะ การตั้งค่าจะระบุเป้าหมายที่จะทำการ scrape
# prometheus.yml
# Prometheus configuration for Spring Boot
global:
  scrape_interval: 15s
  evaluation_interval: 15s

scrape_configs:
  - job_name: 'spring-boot-apps'
    metrics_path: '/actuator/prometheus'
    scrape_interval: 10s
    static_configs:
      - targets:
          - 'order-service:8080'
          - 'payment-service:8080'
          - 'inventory-service:8080'
    # Relabeling to add metadata
    relabel_configs:
      - source_labels: [__address__]
        target_label: instance
        regex: '([^:]+):\d+'
        replacement: '${1}'

  # Kubernetes service discovery
  - job_name: 'kubernetes-pods'
    kubernetes_sd_configs:
      - role: pod
    relabel_configs:
      # Only scrape pods with annotation
      - source_labels: [__meta_kubernetes_pod_annotation_prometheus_io_scrape]
        action: keep
        regex: true
      - source_labels: [__meta_kubernetes_pod_annotation_prometheus_io_path]
        action: replace
        target_label: __metrics_path__
        regex: (.+)
เมตริก JVM พื้นฐาน
Actuator ที่ทำงานคู่กับ Micrometer จะเปิดเผยเมตริก JVM อย่างละเอียดให้โดยอัตโนมัติ เมตริกที่สำคัญที่สุดสำหรับการตรวจสอบมีดังนี้
# PromQL queries for JVM monitoring

# Heap memory usage
jvm_memory_used_bytes{area="heap"}

# Memory usage percentage
jvm_memory_used_bytes{area="heap"} / jvm_memory_max_bytes{area="heap"} * 100

# Active threads
jvm_threads_live_threads

# Garbage collection - time spent
rate(jvm_gc_pause_seconds_sum[5m])

# GC count per minute
rate(jvm_gc_pause_seconds_count[1m]) * 60

# CPU used by JVM
process_cpu_usage

# Active database connections
hikaricp_connections_active

# Connection pool utilization
hikaricp_connections_active / hikaricp_connections_max * 100// Additional JVM metrics
package com.example.monitoring.metrics;
import io.micrometer.core.instrument.Gauge;
import io.micrometer.core.instrument.MeterRegistry;
import io.micrometer.core.instrument.binder.MeterBinder;
import org.springframework.stereotype.Component;
import java.lang.management.ManagementFactory;
import java.lang.management.OperatingSystemMXBean;
@Component
public class CustomJvmMetrics implements MeterBinder {
@Override
public void bindTo(MeterRegistry registry) {
OperatingSystemMXBean osBean = ManagementFactory.getOperatingSystemMXBean();
// System load average
Gauge.builder("system.load.average", osBean, OperatingSystemMXBean::getSystemLoadAverage)
.description("System load average over 1 minute")
.register(registry);
// Available processors count
Gauge.builder("system.cpu.count", osBean, OperatingSystemMXBean::getAvailableProcessors)
.description("Number of available processors")
.register(registry);
// Application uptime
Gauge.builder("application.uptime.seconds",
ManagementFactory.getRuntimeMXBean(),
bean -> bean.getUptime() / 1000.0)
.description("Application uptime in seconds")
.register(registry);
}
}แดชบอร์ด Grafana ที่พร้อมใช้งาน
Grafana มีแดชบอร์ดที่ตั้งค่าล่วงหน้าให้สำหรับ Spring Boot แดชบอร์ด ID 12900 ให้ภาพรวมของเมตริก Actuator อย่างครบถ้วน
{
  "annotations": {
    "list": []
  },
  "panels": [
    {
      "title": "Request Rate",
      "type": "graph",
      "targets": [
        {
          "expr": "rate(http_server_requests_seconds_count{application=\"$application\"}[5m])",
          "legendFormat": "{{method}} {{uri}} - {{status}}"
        }
      ]
    },
    {
      "title": "Response Time P99",
      "type": "graph",
      "targets": [
        {
          "expr": "histogram_quantile(0.99, rate(http_server_requests_seconds_bucket{application=\"$application\"}[5m]))",
          "legendFormat": "{{method}} {{uri}}"
        }
      ]
    },
    {
      "title": "Error Rate",
      "type": "singlestat",
      "targets": [
        {
          "expr": "sum(rate(http_server_requests_seconds_count{application=\"$application\",status=~\"5..\"}[5m])) / sum(rate(http_server_requests_seconds_count{application=\"$application\"}[5m])) * 100"
        }
      ]
    }
  ]
}วิธีการนำเข้าแดชบอร์ด: Grafana → Dashboards → Import → ID 12900 (Spring Boot Statistics) หรือ 4701 (JVM Micrometer) แดชบอร์ดเหล่านี้ใช้งานได้ทันทีกับเมตริกมาตรฐานของ Actuator
การแจ้งเตือนด้วย Prometheus
กฎแจ้งเตือนที่จำเป็น
กฎแจ้งเตือนของ Prometheus จะทริกเกอร์การแจ้งเตือนเมื่อเมตริกเกินเกณฑ์วิกฤต
# alerting-rules.yml
# Alert rules for Spring Boot applications
groups:
  - name: spring-boot-alerts
    rules:
      # Alert if application is down
      - alert: ApplicationDown
        expr: up{job="spring-boot-apps"} == 0
        for: 1m
        labels:
          severity: critical
        annotations:
          summary: "Application {{ $labels.instance }} is down"
          description: "{{ $labels.instance }} has been down for more than 1 minute"

      # Alert on HTTP error rate
      - alert: HighErrorRate
        expr: |
          sum(rate(http_server_requests_seconds_count{status=~"5.."}[5m])) by (application)
          /
          sum(rate(http_server_requests_seconds_count[5m])) by (application)
          > 0.05
        for: 5m
        labels:
          severity: warning
        annotations:
          summary: "High error rate on {{ $labels.application }}"
          description: "Error rate is {{ $value | humanizePercentage }}"

      # Alert on P99 latency
      - alert: HighLatency
        expr: |
          histogram_quantile(0.99,
            rate(http_server_requests_seconds_bucket[5m])
          ) > 2
        for: 5m
        labels:
          severity: warning
        annotations:
          summary: "High latency detected"
          description: "P99 latency is {{ $value | humanizeDuration }}"

      # Heap memory alert
      - alert: HighHeapUsage
        expr: |
          jvm_memory_used_bytes{area="heap"}
          / jvm_memory_max_bytes{area="heap"}
          > 0.85
        for: 5m
        labels:
          severity: warning
        annotations:
          summary: "High heap memory usage on {{ $labels.instance }}"
          description: "Heap usage is at {{ $value | humanizePercentage }}"

      # Database connection pool exhausted alert
      - alert: DatabaseConnectionPoolExhausted
        expr: |
          hikaricp_connections_active
          / hikaricp_connections_max
          > 0.9
        for: 2m
        labels:
          severity: critical
        annotations:
          summary: "Database connection pool nearly exhausted"
          description: "{{ $value | humanizePercentage }} of connections in use"

      # Excessive GC alert
      - alert: HighGCPause
        expr: |
          rate(jvm_gc_pause_seconds_sum[5m])
          / rate(jvm_gc_pause_seconds_count[5m])
          > 0.5
        for: 5m
        labels:
          severity: warning
        annotations:
          summary: "High GC pause time"
          description: "Average GC pause is {{ $value | humanizeDuration }}"
การแจ้งเตือนเหล่านี้ครอบคลุมปัญหาที่พบบ่อยที่สุดในโปรดักชัน ทั้งความพร้อมใช้งาน ประสิทธิภาพ และทรัพยากร
เมตริก HTTP และฐานข้อมูล
การ Instrument คำขอ HTTP โดยอัตโนมัติ
Spring Boot 3 ทำการ instrument คำขอ HTTP ทุกรายการที่เข้ามาโดยอัตโนมัติพร้อมเมตริกอย่างละเอียด
# application.yml
# HTTP metrics configuration
management:
  metrics:
    distribution:
      # Enable histograms for percentiles
      percentiles-histogram:
        http.server.requests: true
      percentiles:
        http.server.requests: 0.5, 0.75, 0.95, 0.99
      # Define SLA buckets
      slo:
        http.server.requests: 100ms, 500ms, 1s, 2s
    tags:
      # Global tags added to all metrics
      application: ${spring.application.name}
environment: ${spring.profiles.active:default}// HTTP tags customization
package com.example.monitoring.config;
import io.micrometer.core.instrument.Tag;
import org.springframework.boot.actuate.metrics.web.servlet.WebMvcTagsContributor;
import org.springframework.context.annotation.Bean;
import org.springframework.context.annotation.Configuration;
import org.springframework.web.servlet.HandlerMapping;
import jakarta.servlet.http.HttpServletRequest;
import jakarta.servlet.http.HttpServletResponse;
import java.util.Collections;
@Configuration
public class WebMvcMetricsConfig {
@Bean
WebMvcTagsContributor customTagsContributor() {
return (request, response, handler, exception) -> {
// Add custom tags to HTTP metrics
String userId = request.getHeader("X-User-Id");
String tenantId = request.getHeader("X-Tenant-Id");
return java.util.List.of(
Tag.of("user.type", userId != null ? "authenticated" : "anonymous"),
Tag.of("tenant", tenantId != null ? tenantId : "default")
);
};
}
}เมตริก HikariCP และคิวรี SQL
เมตริกของ connection pool HikariCP ถูกเปิดเผยให้โดยอัตโนมัติ สำหรับคิวรี SQL การตั้งค่าเพิ่มเติมจะเปิดการ trace ระยะเวลาของคิวรี
# application.yml
# HikariCP configuration with metrics
spring:
  datasource:
    hikari:
      pool-name: OrderServicePool
      maximum-pool-size: 20
      minimum-idle: 5
      connection-timeout: 30000
      idle-timeout: 600000
      max-lifetime: 1800000
      # Enable detailed metrics
register-mbeans: true// Additional metrics for SQL queries
package com.example.monitoring.config;
import io.micrometer.core.instrument.MeterRegistry;
import net.ttddyy.dsproxy.listener.logging.SLF4JLogLevel;
import net.ttddyy.dsproxy.support.ProxyDataSourceBuilder;
import org.springframework.beans.factory.annotation.Qualifier;
import org.springframework.boot.autoconfigure.jdbc.DataSourceProperties;
import org.springframework.context.annotation.Bean;
import org.springframework.context.annotation.Configuration;
import org.springframework.context.annotation.Primary;
import javax.sql.DataSource;
@Configuration
public class DataSourceMetricsConfig {
@Bean
@Primary
DataSource metricsDataSource(
DataSourceProperties properties,
MeterRegistry registry) {
// Original DataSource
DataSource originalDataSource = properties
.initializeDataSourceBuilder()
.build();
// Proxy with metrics
return ProxyDataSourceBuilder.create(originalDataSource)
.name("order-service-db")
.listener(new MicrometerQueryMetricsListener(registry))
.logQueryBySlf4j(SLF4JLogLevel.DEBUG)
.build();
}
}// Listener for SQL query metrics
package com.example.monitoring.metrics;
import io.micrometer.core.instrument.MeterRegistry;
import io.micrometer.core.instrument.Timer;
import net.ttddyy.dsproxy.ExecutionInfo;
import net.ttddyy.dsproxy.QueryInfo;
import net.ttddyy.dsproxy.listener.QueryExecutionListener;
import java.util.List;
import java.util.concurrent.TimeUnit;
public class MicrometerQueryMetricsListener implements QueryExecutionListener {
private final Timer queryTimer;
public MicrometerQueryMetricsListener(MeterRegistry registry) {
this.queryTimer = Timer.builder("sql.query.duration")
.description("SQL query execution duration")
.publishPercentiles(0.5, 0.95, 0.99)
.register(registry);
}
@Override
public void beforeQuery(ExecutionInfo execInfo, List<QueryInfo> queryInfoList) {
// Before execution
}
@Override
public void afterQuery(ExecutionInfo execInfo, List<QueryInfo> queryInfoList) {
// Record duration for each query
long elapsedTime = execInfo.getElapsedTime();
queryTimer.record(elapsedTime, TimeUnit.MILLISECONDS);
}
}แนวทางปฏิบัติที่ดีบนโปรดักชัน
Cardinality ของเมตริก
Cardinality ที่มากเกินไปจะลดประสิทธิภาพของ Prometheus เพราะแต่ละการรวม tag ที่ไม่ซ้ำกันจะสร้าง time series ใหม่หนึ่งชุด
// ❌ AVOID - Explosive cardinality
package com.example.monitoring.antipattern;

@Service
public class AntiPatternHighCardinality {

    private final MeterRegistry registry;

    // ❌ BAD: userId creates one series per user
    public void trackUserAction(String userId, String action) {
        Counter.builder("user.actions")
            .tag("userId", userId)  // Millions of possible values!
            .tag("action", action)
            .register(registry)
            .increment();
    }
}// ✅ Controlled cardinality
package com.example.monitoring.bestpractice;
@Service
public class GoodPracticeCardinality {
private final MeterRegistry registry;
// ✅ GOOD: User category instead of ID
public void trackUserAction(User user, String action) {
Counter.builder("user.actions")
.tag("userType", user.getSubscriptionType()) // FREE, PREMIUM, ENTERPRISE
.tag("action", action)
.register(registry)
.increment();
}
// ✅ GOOD: Grouping by range
public void trackResponseTime(long responseTimeMs) {
String bucket = categorizeResponseTime(responseTimeMs);
Counter.builder("response.time.bucket")
.tag("bucket", bucket) // fast, normal, slow, very_slow
.register(registry)
.increment();
}
private String categorizeResponseTime(long ms) {
if (ms < 100) return "fast";
if (ms < 500) return "normal";
if (ms < 2000) return "slow";
return "very_slow";
}
}การตั้งค่าที่พร้อมใช้งานบนโปรดักชัน
# application-production.yml
# Optimized configuration for production
management:
  endpoints:
    web:
      exposure:
        include: health,info,prometheus
  endpoint:
    health:
      show-details: when-authorized
      probes:
        enabled: true
  metrics:
    export:
      prometheus:
        enabled: true
        step: 30s
    distribution:
      percentiles-histogram:
        http.server.requests: true
      minimum-expected-value:
        http.server.requests: 1ms
      maximum-expected-value:
        http.server.requests: 30s
    tags:
      application: ${spring.application.name}
      environment: production
      version: ${app.version:unknown}
  server:
    # Separate port for management endpoints
    port: 9090

# Disable non-essential endpoints in production
  endpoint:
    env:
      enabled: false
    beans:
      enabled: false
    configprops:
      enabled: false
    mappings:
      enabled: false
บทสรุป
Spring Boot Actuator เมื่อรวมกับ Micrometer และ Prometheus มอบโซลูชันการตรวจสอบที่ครบครัน:
✅ การตั้งค่าน้อยที่สุด — endpoint พร้อมใช้งานบนโปรดักชันด้วย Spring Boot Starter
✅ เมตริก JVM อัตโนมัติ — หน่วยความจำ เธรด GC และ CPU โดยไม่ต้องเขียนโค้ดเพิ่ม
✅ เมตริกแบบกำหนดเอง — Counter, Gauge, Timer พร้อมแอนโนเทชัน @Timed/@Counted
✅ Health Indicator — ตรวจสอบบริการภายนอกและสถานะของ Kubernetes
✅ เชื่อมต่อกับ Prometheus — ฟอร์แมตมาตรฐานสำหรับการ scrape และการแจ้งเตือน
✅ ความปลอดภัยในตัว — ควบคุมการเข้าถึง endpoint ที่อ่อนไหว
✅ แดชบอร์ด Grafana — แสดงผลทันทีด้วยแดชบอร์ดที่ตั้งค่าล่วงหน้า
✅ การแจ้งเตือน — กฎ PromQL สำหรับตรวจจับความผิดปกติบนโปรดักชัน
สแต็ก observability ชุดนี้คือพื้นฐานสำคัญที่ช่วยให้ดูแลแอปพลิเคชัน Spring Boot บนโปรดักชันได้อย่างมั่นใจ
เริ่มฝึกซ้อมเลย!
ทดสอบความรู้ของคุณด้วยตัวจำลองสัมภาษณ์และแบบทดสอบเทคนิคครับ
แท็ก
แชร์
บทความที่เกี่ยวข้อง

Spring Boot Logging ในปี 2026: ล็อกแบบมีโครงสร้างสำหรับโปรดักชันด้วย Logback และ JSON
คู่มือฉบับสมบูรณ์สำหรับ structured logging ใน Spring Boot การตั้งค่า Logback JSON, MDC สำหรับ tracing แนวปฏิบัติที่ดีที่สุดในโปรดักชัน และการรวมกับ ELK Stack

Spring Kafka: สถาปัตยกรรม event-driven พร้อม consumer ที่ทนทาน
คู่มือ Spring Kafka แบบครบถ้วนสำหรับสถาปัตยกรรม event-driven การตั้งค่า consumer ที่ทนทาน นโยบาย retry dead letter queue และรูปแบบโปรดักชันสำหรับแอปพลิเคชันแบบกระจาย
สัมภาษณ์ Spring GraphQL: Resolver, DataLoader และวิธีแก้ปัญหา N+1
เตรียมตัวสำหรับการสัมภาษณ์ Spring GraphQL ด้วยคู่มือที่ครบถ้วนนี้ Resolver, DataLoader, การจัดการปัญหา N+1, mutation และแนวปฏิบัติที่ดีที่สุดสำหรับคำถามทางเทคนิค