Go Profiling and Benchmarking in 2026: pprof, trace and Interview Questions
Master Go profiling with pprof and runtime/trace. CPU, memory, and goroutine analysis techniques for performance optimization and interview preparation.
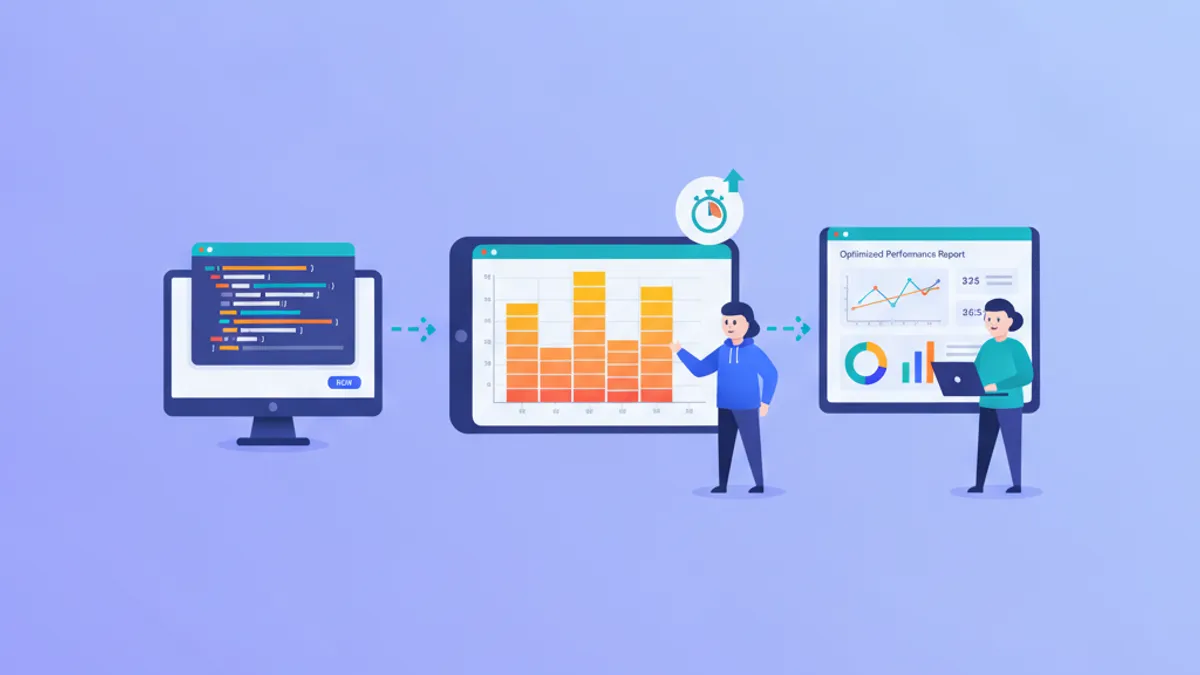
Go profiling with pprof and the runtime/trace package turns guesswork into data. Performance questions appear in most Go interviews, and candidates who can read a flame graph or explain when to use -inuse_space versus -allocs stand out. The tooling ships with the standard library, requires no external dependencies, and integrates directly with benchmarks.
Go 1.24+ provides seven built-in profiles: CPU, heap, allocs, goroutine, threadcreate, block, and mutex. Go 1.26 added an experimental goroutine leak profile that detects unreachable blocked goroutines.
CPU Profiling with pprof: The Starting Point
CPU profiling samples the call stack at regular intervals (default 100 Hz) and records which functions consume processor time. The runtime/pprof package handles the low-level collection, while go tool pprof analyzes the results. A 30-second profile captures 3000 samples, enough for statistical significance in most applications.
A standalone program enables profiling by calling pprof.StartCPUProfile at startup. The profile writes to a file that go tool pprof reads later:
package main

import (
	"flag"
	"log"
	"os"
	"runtime/pprof"
)

var cpuprofile = flag.String("cpuprofile", "", "write cpu profile to file")

func main() {
	flag.Parse()
	if *cpuprofile != "" {
		f, err := os.Create(*cpuprofile)
		if err != nil {
			log.Fatal(err)
		}
		defer f.Close()
		pprof.StartCPUProfile(f)
		defer pprof.StopCPUProfile()
	}
	// Application logic here
}
For HTTP servers, import net/http/pprof as a side effect. The package registers handlers at /debug/pprof/ automatically. No code changes beyond the import are needed:
package main

import (
	"net/http"
	_ "net/http/pprof" // Registers /debug/pprof/* handlers
)

func main() {
	http.HandleFunc("/", handler)
	http.ListenAndServe(":8080", nil)
}
Fetch a 30-second CPU profile from a running server with go tool pprof http://localhost:8080/debug/pprof/profile?seconds=30. The tool downloads the profile and opens an interactive shell. The seconds parameter controls the collection duration.
Analyzing Profiles: top, list, and Flame Graphs
The pprof shell provides commands to identify bottlenecks. top shows the functions consuming the most CPU time, sorted by flat time. The list command displays source code with per-line timing annotations, pinpointing the exact lines that dominate execution.
# Terminal session with go tool pprof
$ go tool pprof cpu.prof
(pprof) top 10
Showing nodes accounting for 4.2s, 85% of 4.9s total
      flat  flat%   sum%        cum   cum%
     1.8s 36.73% 36.73%      1.8s 36.73%  runtime.memmove
     0.9s 18.37% 55.10%      0.9s 18.37%  encoding/json.(*decodeState).scanWhile
     0.5s 10.20% 65.30%      2.3s 46.94%  main.processRecords
     ...

(pprof) list processRecords
Total: 4.9s
     0.5s      2.3s (flat, cum) 46.94% of Total
      20:   for _, r := range records {
      21:       0.3s    0.3s    data := json.Marshal(r)
      22:       0.2s    2.0s    result := transform(data)
      ...
The web interface adds visual analysis. Run go tool pprof -http=:6060 cpu.prof to open a browser with flame graphs, directed graphs, and source views. Since Go 1.26, flame graphs appear as the default view in the web UI. Flame graphs show the call hierarchy horizontally, with wider bars indicating more time spent in that function and its callees.
In a flame graph, the x-axis represents the population of samples, not time. Each box is a function, and its width shows how often that function appeared in samples. Parent functions sit below their children. Look for wide plateaus at the top: those functions do the actual work.
Memory Profiling: Heap vs Allocs
Memory profiling answers two distinct questions. The heap profile (-inuse_space) shows what retains memory at the moment of capture. The allocs profile shows where allocations occurred over time, even if that memory has since been freed.
To reduce current memory usage, examine the heap profile. To reduce allocation rate and GC pressure, examine the allocs profile. High allocation rates trigger frequent garbage collection, which pauses goroutines and increases CPU usage.
# Capture heap profile from running server
$ curl -o heap.prof http://localhost:8080/debug/pprof/heap
$ go tool pprof -inuse_space heap.prof

# Capture allocs profile (allocation count over 30s)
$ curl -o allocs.prof "http://localhost:8080/debug/pprof/allocs?seconds=30"
$ go tool pprof -alloc_objects allocs.prof
The -inuse_objects flag counts live objects rather than bytes, useful for identifying memory fragmentation. The -alloc_space flag shows total bytes allocated over the profile period, revealing functions that churn through memory even if they release it quickly.
Common allocation hotspots include string concatenation in loops (use strings.Builder), interface conversions that escape to the heap, and slice growth without preallocation. The Go compiler documentation explains escape analysis in detail.
Benchmark Profiling with testing.B
The testing package integrates profiling directly into benchmarks. This combination isolates specific code paths without the noise of a full application. Benchmark profiling answers the question: "How does this function perform in isolation?"
package parser

import "testing"

func BenchmarkParseJSON(b *testing.B) {
	data := []byte(`{"id":1,"name":"test","values":[1,2,3]}`)
	b.ReportAllocs() // Include allocation stats
	b.ResetTimer()   // Exclude setup from timing
	for i := 0; i < b.N; i++ {
		_, _ = Parse(data)
	}
}
Generate profiles during benchmark execution with flags. The -cpuprofile and -memprofile flags write profiles to files for later analysis:
# CPU profile during benchmark
$ go test -bench=BenchmarkParseJSON -cpuprofile=cpu.prof -benchtime=5s

# Memory profile during benchmark
$ go test -bench=BenchmarkParseJSON -memprofile=mem.prof -benchtime=5s

# Analyze the result
$ go tool pprof -http=:6060 cpu.prof
The -benchtime flag controls how long the benchmark runs. Longer runs produce more accurate profiles but take more time. A 5-second run typically provides stable results. For micro-benchmarks, use -count=10 to run multiple iterations and check for variance.
Ready to ace your Go interviews?
Practice with our interactive simulators, flashcards, and technical tests.
Execution Tracing with runtime/trace
While pprof shows where time is spent, runtime/trace shows when events occur. The trace captures goroutine scheduling, system calls, GC events, and network activity on a timeline. This visibility into concurrency behavior complements statistical profiling.
package main

import (
	"os"
	"runtime/trace"
)

func main() {
	f, _ := os.Create("trace.out")
	defer f.Close()
	trace.Start(f)
	defer trace.Stop()

	// Application logic
	runConcurrentTasks()
}
The trace viewer displays goroutine lifetimes, blocking events, and processor utilization. Each goroutine appears as a horizontal bar, with colors indicating whether it ran, blocked, or waited for scheduling:
$ go tool trace trace.out
# Opens browser at http://127.0.0.1:port
For HTTP servers, fetch a trace from /debug/pprof/trace?seconds=5. The trace viewer shows which goroutines blocked on what, revealing contention patterns that CPU profiles miss. The "Goroutine analysis" view groups goroutines by creation site, helping identify leaks or unexpected fan-out.
Traces are heavier than profiles. A 5-second trace of a busy server can produce hundreds of megabytes of data. Use short durations and targeted collection. The Go blog on execution tracing covers advanced analysis techniques.
Block and Mutex Profiling for Contention
Block profiling records goroutines waiting on synchronization primitives: channels, mutexes, and condition variables. Mutex profiling focuses specifically on mutex contention. These profiles reveal concurrency bottlenecks invisible to CPU profiling.
Enable these profiles by setting runtime parameters before the contention occurs:
// Enable block profiling (1 = sample all blocking events)
runtime.SetBlockProfileRate(1)

// Enable mutex profiling (1 = sample all mutex contention)
runtime.SetMutexProfileFraction(1)
For production, set higher values to reduce overhead. A block profile rate of 1000000 (one microsecond) or mutex fraction of 100 provides useful data with minimal impact. Setting these values too low captures every event and can slow the application.
Fetch these profiles from the standard endpoints:
$ curl -o block.prof http://localhost:8080/debug/pprof/block
$ curl -o mutex.prof http://localhost:8080/debug/pprof/mutex
$ go tool pprof block.prof
Block profiles show total time spent waiting, not the number of blocking events. A function that blocks for 1 second once looks identical to one that blocks for 1 millisecond 1000 times. Use execution tracing to distinguish these cases.
Common Profiling Pitfalls
Profiling introduces overhead that can skew results. CPU profiling adds roughly 5% overhead. Memory profiling samples allocations (1 per 512KB by default), so small allocations may not appear. Tracing captures every event and can add 10-30% overhead.
Several mistakes lead to misleading profiles:
Profiling optimized builds differently. Always profile with the same build flags used in production. Debug builds disable inlining and optimizations, making hot spots appear in different places.
Profiling under artificial load. A profile of an idle server shows the idle loop, not real bottlenecks. Profile under realistic traffic patterns.
Ignoring GC overhead. CPU profiles include time spent in garbage collection. A high runtime.gc* presence indicates memory allocation problems, not CPU problems. Address those with memory profiling.
Short profiling durations. A 1-second profile captures only 100 samples. Statistical noise dominates. Profile for at least 30 seconds under steady load.
Go Interview Questions on Profiling
Performance questions test whether a candidate can diagnose real problems. Interviewers look for familiarity with the tooling and understanding of what each profile reveals.
Q: When would heap profiling show different results than allocs profiling?
Heap shows memory retained at capture time. Allocs shows all allocations, including freed memory. A function that allocates temporary buffers in a loop appears in allocs but not in heap if the buffers are collected before the snapshot. Use allocs to reduce GC pressure, heap to find leaks.
Q: A goroutine appears stuck. Which profile helps?
The goroutine profile shows stack traces of all goroutines. The block profile shows where goroutines wait. For Go 1.26+, the experimental goroutine leak profile detects unreachable goroutines blocked on channels or mutexes. Execution tracing shows the timeline of blocking events.
Q: What does a flat percentage versus cumulative percentage mean in pprof?
Flat measures time in the function itself. Cumulative includes time in functions it calls. A function with high cumulative but low flat time is a coordinator that delegates work. A function with high flat time does the actual computation. Optimize functions with high flat time first.
Q: How do you profile a benchmark without profiling the test setup?
Call b.ResetTimer() after setup completes. For benchmarks with per-iteration setup, use b.StopTimer() and b.StartTimer() around the setup code. The timer calls have nanosecond overhead, so avoid them in tight loops.
Q: Why might a function not appear in a CPU profile despite being slow?
CPU profiling only captures functions actively using CPU. I/O-bound functions (waiting on network, disk, or channels) appear in block profiles or traces, not CPU profiles. Sampling can also miss functions that run for less than 10ms total.
Q: How does the Go 1.24 Swiss Tables map implementation affect profiling?
Go 1.24 replaced the bucket-based map with Swiss Tables, reducing CPU overhead by 2-3% for map-heavy workloads. Profiles taken before and after the upgrade show different map-related call stacks. The GOEXPERIMENT=noswissmap flag reverts to the old implementation for comparison.
Continuous Profiling in Production
Point-in-time profiles miss transient issues. Continuous profiling tools like Pyroscope or Parca collect low-overhead samples continuously, enabling comparison across deployments. These tools correlate profiles with metrics and traces.
Go's built-in profiles work with these tools through the pprof format. The pprof.me service added comparison features in 2026, allowing upload and diff of profiles to quantify optimization impact before and after code changes.
For Go interview preparation, understanding both the tooling and the underlying concepts matters. The context package and concurrency patterns frequently appear alongside profiling questions. Performance optimization often requires combining profiling data with knowledge of Go's runtime behavior.
What Go Profiling Reveals About Application Behavior
- CPU profiles identify hot functions but miss I/O-bound work. Combine with trace for the full picture.
- Memory profiles distinguish retention problems (heap) from allocation churn (allocs). Use
-inuse_spacefor leaks,-alloc_spacefor GC pressure. - Block and mutex profiles expose contention that CPU profiles cannot see. Enable them when latency spikes under load.
- Benchmark profiling isolates specific code paths. Always call
b.ReportAllocs()andb.ResetTimer()for accurate measurements. - The trace viewer shows goroutine scheduling and blocking events on a timeline, essential for diagnosing concurrency bugs.
- Go 1.24 runtime improvements reduced CPU overhead by 2-3% through Swiss Tables maps and a new mutex implementation.
- Production profiling with the
/debug/pprof/endpoints requires authentication. Never expose these endpoints publicly: they leak internal application state and can enable denial-of-service through expensive profile collection.
Start practicing!
Test your knowledge with our interview simulators and technical tests.
Can you spot the bug in Go?
One real snippet, one hidden bug, one attempt a day. No account needed to try.

Written by
Anthony Fillion-MailletFounder of SharpSkill
Full-stack developer for over 10 years. Runs SharpSkill and answers for everything published here.
Updated on September 19, 2026
Share
Related articles
Advanced Go Interfaces in 2026: Composition, Type Assertions and Interview Questions
Master Go interface composition, type assertions, and self-referential generics from Go 1.26. Includes practical examples and technical interview questions.

Go Context Package in 2026: Cancellation, Timeouts and Interview Questions
Master Go's context package for managing cancellation, deadlines, and request-scoped values. Complete guide with practical examples and interview questions.

Go Testing in 2026: Unit Tests, Mocks and Technical Interview Questions
Master Go testing with the standard library, table-driven tests, mocks, and the patterns interviewers expect. Practical examples with testify, gomock, and the testing package.