SRE Principles in 2026: Reliability Engineering, SLOs and Interview Questions
SRE principles explained for 2026: how to choose SLIs, set SLOs, compute error budgets, write multi-window burn rate alerts in Prometheus, and answer the SRE interview questions that come back in every loop.
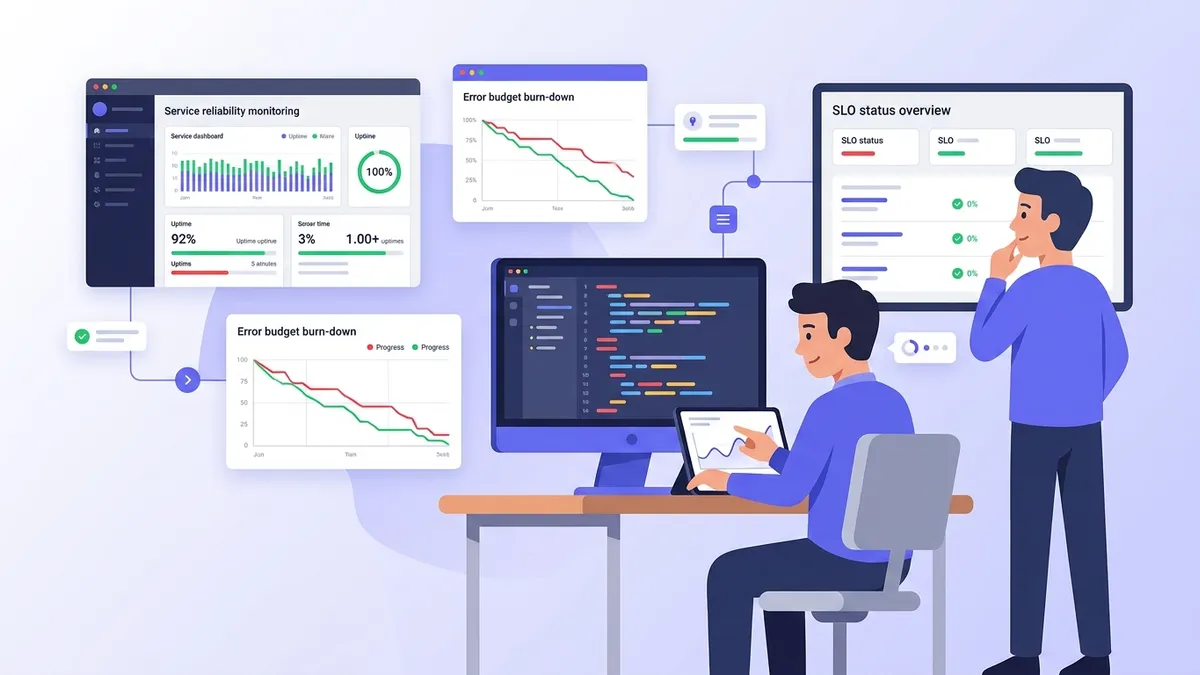
SRE principles turn reliability from a vague goal into a number that engineering and product agree on, then use that number to decide when to ship and when to stop. Site reliability engineering, as defined by Google and now practiced in most platform teams, rests on a few ideas: measure what users experience (SLIs), set a target below 100% (SLOs), spend the gap as an error budget, and cap the manual work that keeps systems running. SRE interview questions in 2026 test exactly these ideas, usually by asking the candidate to define an SLO for a real service and write the alert that protects it.
An SLI is a measurement: the ratio of good events to valid events, such as successful requests over all requests. An SLO is the internal target for that ratio over a window, such as 99.9% over 30 days. An SLA is the contractual promise to customers, with penalties, and it is always looser than the SLO.
Core SRE principles behind site reliability engineering
The Google SRE book frames reliability as a feature with a cost. Every additional nine costs more engineering time and slows releases, while users rarely notice the difference between 99.99% and 99.999% because their own network, device and ISP are less reliable than that. The goal is the right level of reliability, not the maximum.
From that starting point, a handful of principles follow:
- Reliability is measured from the user's side. CPU usage and pod restarts are causes. Failed checkouts and slow page loads are what users experience, and that is what an SLI captures.
- 100% is the wrong target. A 100% SLO forbids every change, since every deploy carries risk. The gap below 100% is the error budget, and it is meant to be spent on releases, experiments and migrations.
- Toil is capped. Google's guideline in the chapter on eliminating toil keeps operational work below 50% of an SRE's time. Toil is manual, repetitive, automatable and grows linearly with the service. The rest of the time goes to engineering that removes it.
- Postmortems are blameless. An incident review asks what in the system allowed the failure, not who typed the command. A blamed engineer hides information; a blameless review surfaces it.
- Monitoring alerts on symptoms. A page fires when users are hurt or about to be, not when a single node looks unusual.
In an interview, the distinction that separates a confirmed SRE from someone who has only read the book is the second point. A junior answer treats the error budget as a tolerance for failure. A senior answer treats it as a release-management tool: it is the mechanism that lets product and reliability argue with data instead of opinions.
Choosing SLIs that reflect user experience
A good SLI is a ratio between 0 and 1, computed from events the user would recognize. The SRE workbook recommends a short menu depending on the service type:
| Service type | Typical SLIs | Where to measure |
|---|---|---|
| Request-driven API | Availability, latency | Load balancer or ingress logs, server metrics |
| Data pipeline | Freshness, correctness, coverage | Pipeline output timestamps, validation jobs |
| Storage system | Durability, read and write latency | Storage layer, synthetic probes |
| Frontend | Page load time, error rate seen by the browser | Real user monitoring |
Measuring at the load balancer catches failures the application never sees, such as a crashed pod returning nothing. Measuring in the browser catches CDN and DNS issues but adds noise from bad mobile connections. Most teams start at the load balancer or ingress because the data is already there.
With Prometheus, the two classic SLIs for an HTTP service are an availability ratio and a latency ratio. The latency SLI counts requests faster than a threshold as good, which makes it a ratio like the others instead of a percentile.
# checkout-sli.promql
# Availability SLI: share of requests that did not fail with a 5xx
sum(rate(http_requests_total{job="checkout-api", code!~"5.."}[5m]))
/
sum(rate(http_requests_total{job="checkout-api"}[5m]))

# Latency SLI: share of requests served in under 300 ms
# Uses the histogram bucket with le="0.3", so 0.3 must be a configured bucket boundary
sum(rate(http_request_duration_seconds_bucket{job="checkout-api", le="0.3"}[5m]))
/
sum(rate(http_request_duration_seconds_count{job="checkout-api"}[5m]))
Two details come up in interviews. First, 4xx responses usually count as valid but good, because a 404 or a validation error is the client's mistake; counting them as failures lets a misbehaving client burn the budget. Second, the latency threshold must match a histogram bucket boundary, otherwise the query returns nothing or silently uses the wrong bucket. Prometheus 3.16, released on 5 November 2026, supports native histograms, which remove the fixed-bucket constraint but need to be enabled on the scrape side.
Setting SLO targets and computing the error budget
An SLO combines an SLI, a target and a window. The window is usually rolling, 28 or 30 days, so the budget recovers gradually instead of resetting on the first of the month. The target is picked from historical performance and user expectations, not from what sounds good in a slide.
The table below shows what each target allows over a 30-day window. These are plain arithmetic: the budget is (1 - SLO) × 30 days.
| SLO target | Error budget | Allowed full downtime in 30 days |
|---|---|---|
| 99% | 1% | 7 h 12 min |
| 99.5% | 0.5% | 3 h 36 min |
| 99.9% | 0.1% | 43 min 12 s |
| 99.95% | 0.05% | 21 min 36 s |
| 99.99% | 0.01% | 4 min 19 s |
For request-based SLOs, the budget is expressed in requests rather than minutes: at 99.9% with 12 million requests in the window, 12,000 failed requests are allowed. Request-based budgets are fairer for services with uneven traffic, because an outage at 3 a.m. costs less budget than the same outage at peak.
A common interview task is to compute the remaining budget and how fast it is being consumed. The script below is the kind of answer expected when the question asks for code.
# error_budget.py
from dataclasses import dataclass

@dataclass
class SloWindow:
    objective: float      # 0.999 for a 99.9% SLO
    window_days: int      # rolling window, usually 28 or 30
    total_requests: int   # valid events seen in the window so far
    failed_requests: int  # bad events seen in the window so far

    @property
    def budget_fraction(self) -> float:
        return 1 - self.objective  # 0.001 for 99.9%

    def budget_remaining(self) -> float:
        """1.0 means untouched, 0 means spent, negative means SLO breached."""
        allowed_failures = self.budget_fraction * self.total_requests
        return 1 - self.failed_requests / allowed_failures

    def burn_rate(self, recent_errors: int, recent_total: int) -> float:
        """1.0 means the budget lasts exactly the window; 10 means ten times too fast."""
        return (recent_errors / recent_total) / self.budget_fraction

    def hours_to_exhaustion(self, burn: float) -> float:
        # Remaining share of budget, consumed at `burn` times the sustainable pace
        return self.budget_remaining() * self.window_days * 24 / burn

slo = SloWindow(objective=0.999, window_days=30, total_requests=12_000_000, failed_requests=7_800)
burn = slo.burn_rate(recent_errors=240, recent_total=16_000)
print(f"budget left: {slo.budget_remaining():.0%}")             # 35%
print(f"burn rate: {burn:.1f}")                                 # 15.0
print(f"exhausted in: {slo.hours_to_exhaustion(burn):.1f} h")   # 16.8 h
A burn rate of 15 means the service fails at 1.5% of requests while the SLO allows 0.1%. At that pace, the 35% of budget left is gone in under 17 hours, which justifies waking someone up.
Ready to ace your DevOps interviews?
Practice with our interactive simulators, flashcards, and technical tests.
Burn rate alerting with multiple windows
Alerting directly on the SLI ("error rate above 0.1%") produces pages for every short spike and misses slow leaks. The SRE workbook chapter on alerting on SLOs recommends multi-window, multi-burn-rate alerts instead. Each alert answers one question: is the budget being spent fast enough that it will be exhausted before someone looks at it?
The reference thresholds for a 30-day window are:
| Severity | Long window | Short window | Burn rate | Budget consumed when it fires |
|---|---|---|---|---|
| Page | 1 h | 5 min | 14.4 | 2% |
| Page | 6 h | 30 min | 6 | 5% |
| Ticket | 3 days | 6 h | 1 | 10% |
The long window gives significance: one bad minute does not page. The short window, one twelfth of the long one, makes the alert reset quickly once the incident is over, so the page does not keep firing for an hour after the fix. Both conditions must be true at the same time.
The first block records the error ratio at each window so that alert expressions stay cheap. The second block defines the two paging alerts for a 99.9% SLO, where the budget fraction is 0.001.
# checkout-slo-recording.rules.yml
groups:
  - name: checkout-slo-recording
    interval: 30s
    rules:
      - record: slo:sli_error:ratio_rate5m
        expr: |
          sum(rate(http_requests_total{job="checkout-api", code=~"5.."}[5m]))
          / sum(rate(http_requests_total{job="checkout-api"}[5m]))
      - record: slo:sli_error:ratio_rate1h
        expr: |
          sum(rate(http_requests_total{job="checkout-api", code=~"5.."}[1h]))
          / sum(rate(http_requests_total{job="checkout-api"}[1h]))
# Same pattern for 30m and 6h, omitted for brevity# checkout-slo-alerts.rules.yml
groups:
- name: checkout-slo-alerts
rules:
- alert: CheckoutErrorBudgetFastBurn
# 2% of the monthly budget spent in one hour
expr: |
slo:sli_error:ratio_rate1h > (14.4 * 0.001)
and slo:sli_error:ratio_rate5m > (14.4 * 0.001)
labels:
severity: page
annotations:
summary: "checkout-api burns its error budget 14x too fast"
- alert: CheckoutErrorBudgetSlowBurn
# 5% of the monthly budget spent in six hours
expr: |
slo:sli_error:ratio_rate6h > (6 * 0.001)
and slo:sli_error:ratio_rate30m > (6 * 0.001)
labels:
severity: pageWriting these rules by hand for every service gets repetitive. Sloth, an open-source SLO generator, takes a short spec and produces the recording rules and multi-burn-rate alerts above. The {{.window}} placeholder is replaced by each window Sloth needs.
# checkout-slo.sloth.yml
version: "prometheus/v1"
service: "checkout-api"
labels:
  owner: "payments-team"
slos:
  - name: "requests-availability"
    objective: 99.9
    description: "Checkout requests that do not fail with a 5xx"
    sli:
      events:
        error_query: sum(rate(http_requests_total{job="checkout-api",code=~"5.."}[{{.window}}]))
        total_query: sum(rate(http_requests_total{job="checkout-api"}[{{.window}}]))
    alerting:
      name: CheckoutHighErrorRate
      page_alert:
        labels:
          severity: page
      ticket_alert:
        labels:
          severity: ticket
Teams that want a vendor-neutral format look at the OpenSLO specification, which describes SLOs in YAML independently of the monitoring backend.
Error budget policy and release decisions
An error budget without a policy is a dashboard nobody acts on. The example error budget policy in the SRE workbook spells out what happens when the budget runs out, and who signed off on it in advance.
A typical policy contains:
- The trigger. The service has exceeded its error budget over the rolling window.
- The consequence. Feature releases stop, except for security fixes and changes that improve reliability, until the service is back within its SLO.
- The exception path. A single incident caused by a dependency outside the team's control may be excluded, with the decision documented.
- The escalation. Disagreements go to a named role, such as the CTO, not to whoever argues loudest.
The policy is signed by product and engineering before the first breach, which is the whole point: the freeze becomes a pre-agreed rule instead of a fight during an incident. Interviewers often ask what happens when the budget is consistently untouched. The expected answer is that the SLO may be too loose, or the team is shipping too cautiously, and the budget should be spent on faster releases or riskier migrations.
Setting the internal SLO equal to the customer SLA leaves no margin: the first breach of the SLO is already a contractual penalty. The SLO should be stricter than the SLA, so that alerts fire and the freeze starts while the contract is still met.
Toil reduction, on-call and blameless postmortems
SRE time is split between operations and engineering. Operations covers on-call, tickets and manual interventions. Engineering covers automation, capacity planning and reliability features. When toil grows past the 50% guideline, the SRE team pushes work back to the development team or invests in automation, otherwise the team becomes an operations team with a new title.
On-call health is measured, not assumed. Useful signals are pages per shift, the share of pages that required action, and time to acknowledge. A page that requires no action is a bug in the alerting and gets fixed or deleted. Symptom-based alerts on SLO burn, as in the rules above, cut the volume of pages compared with alerts on CPU, memory or individual pod restarts.
When an incident happens, the postmortem culture chapter of the SRE book describes the review that follows. A postmortem records the impact in SLO terms (how much budget was spent), the timeline, the contributing factors and the action items with owners and dates. It avoids naming a person as the cause. Two interview follow-ups are common: how to make sure action items are actually done (track them in the same backlog as features, review them in a recurring meeting) and when a postmortem is required (any incident that consumed a significant share of the budget, any page that woke someone, any data loss).
The four golden signals from the SRE book, latency, traffic, errors and saturation, round out the monitoring picture. Latency and errors usually become SLIs. Traffic and saturation feed capacity planning and dashboards rather than pages.
SRE interview questions with expected answers
These are the questions that come back in SRE and senior DevOps loops, with the core of a strong answer. The SRE principles interview module drills the same topics, and the alerting and incident response module covers the on-call side.
Q: What is the difference between an SLI, an SLO and an SLA?
The SLI is the measured ratio, the SLO is the internal target for it over a window, the SLA is the external contract with penalties. The SLO is stricter than the SLA so that the team reacts before money is lost.
Q: Why not set the SLO to 100%?
Because every change carries risk, so a 100% target forbids releases. Users also cannot perceive reliability above that of their own network. The gap below 100% is the error budget, which funds releases.
Q: Define an SLO for a checkout API.
A strong answer picks two SLIs (availability excluding 4xx, latency under a threshold at the load balancer), a rolling 30-day window, targets based on the last quarter of data, and states how the alerting and the error budget policy follow from them. Naming only "99.99% uptime" without saying what is measured is the classic weak answer.
Q: Why are percentile-based alerts on p99 latency a poor SLO alert?
A p99 over a short window is noisy and cannot be aggregated across instances. Turning latency into a ratio of requests below a threshold makes it additive, comparable with the availability SLI, and compatible with burn rate alerts.
Q: Explain burn rate and why alerts use two windows.
Burn rate is the observed error ratio divided by the budget fraction; 1 means the budget lasts exactly the window. The long window filters out short spikes, the short window lets the alert clear quickly after recovery.
Q: What is toil, and how is it kept under control?
Manual, repetitive, automatable work with no lasting value that scales with the service. It is measured, capped (Google uses 50%), and reduced through automation or by handing work back to the owning team.
Q: What makes a postmortem blameless?
It focuses on the system conditions that allowed the failure, assumes people acted reasonably with the information they had, and produces tracked action items. The test: would the engineer involved share every detail without fear?
Monitoring questions often follow SLO questions in the same interview. The Prometheus interview questions guide covers PromQL, metric types and cardinality, and the DevOps technology page lists every module for broader preparation.
SLOs and error budgets in practice: what to retain
- Define each SLI as a ratio of good events to valid events, measured as close to the user as the data allows, with 4xx excluded from failures for most APIs
- Pick the SLO from historical data and a rolling 28 or 30-day window, and keep it stricter than any customer SLA
- Convert the target into a budget in minutes or requests, and know the numbers by heart: 99.9% over 30 days is 43 minutes
- Alert on burn rate with paired windows (14.4 over 1 h and 5 min, 6 over 6 h and 30 min), not on raw error rate or CPU
- Generate rules with Sloth or a similar tool once more than a couple of services have SLOs, so thresholds stay consistent
- Write and sign the error budget policy before the first breach, including the freeze rule and the escalation path
- Track toil, page volume and postmortem action items with the same rigor as features
Start practicing!
Test your knowledge with our interview simulators and technical tests.
Can you spot the bug in DevOps?
One real snippet, one hidden bug, one attempt a day. No account needed to try.

Written by
Anthony Fillion-MailletFounder of SharpSkill
Full-stack developer for over 10 years. Runs SharpSkill and answers for everything published here.
Updated on November 7, 2026
Tags
Share
Related articles

Prometheus Interview Questions 2026: Prometheus vs Grafana vs Datadog Compared
Prometheus interview questions for DevOps and SRE roles, with answers on PromQL, metric types, cardinality and HA, plus a Prometheus vs Grafana vs Datadog comparison of architecture, alerting and pricing.
DevOps Pipeline Security in 2026: DevSecOps Best Practices and Interview Questions
Master DevSecOps pipeline security with SAST, DAST, secrets management, OIDC authentication, and supply chain protection. Includes common interview questions and answers for DevOps security roles.
Ansible vs Terraform in 2026: Infrastructure as Code and DevOps Interview Questions
Compare Ansible vs Terraform for infrastructure as code in 2026. Understand configuration management vs provisioning, when to use each tool, and prepare for DevOps interview questions.