Apache Superset in 2026: Dashboards, SQL Lab and Interview Questions
A deep dive into Apache Superset: building data analytics dashboards, SQL Lab and Jinja templating, how it compares to Tableau, and the interview questions that matter.
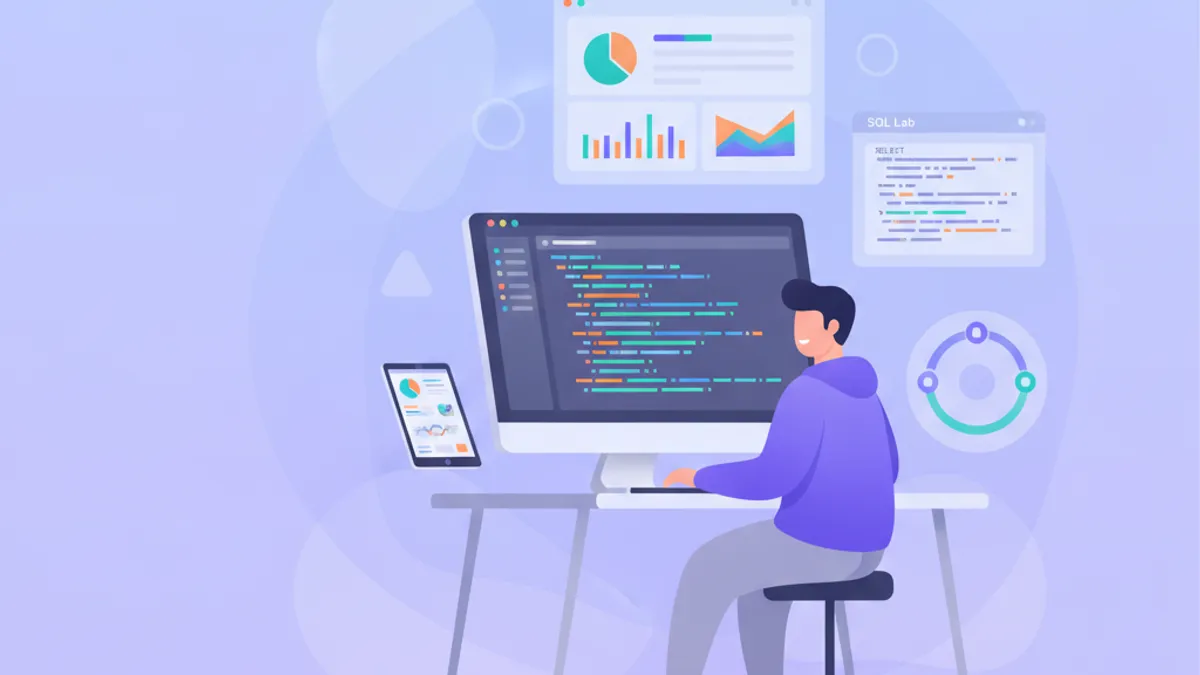
Apache Superset has become the default open-source business intelligence platform for teams that want data analytics dashboards without per-seat licensing. The 6.x release line, current in 2026, ships a complete Ant Design v5 redesign, native dark mode, and a hierarchical semantic layer that narrows much of the gap with commercial tools. This deep dive covers how Superset builds dashboards, why SQL Lab and Jinja templating make it powerful, how it compares to Tableau, and the Apache Superset interview questions that come up most often.
Apache Superset is an open-source data exploration and visualization platform maintained by the Apache Software Foundation. It connects to any SQL-speaking database through SQLAlchemy, exposes a no-code chart builder alongside a full SQL IDE, and assembles charts into interactive dashboards — all self-hosted, with no per-user license fees.
Where Apache Superset Fits in the Modern Data Stack
Superset is a Python application built on Flask, SQLAlchemy, and a React frontend. It stores its own configuration, charts, and dashboards in a metadata database (Postgres or MySQL), runs asynchronous queries through Celery workers, and caches results in Redis. Critically, it never copies analytical data into its own storage: every chart issues live SQL against the connected warehouse, so Superset behaves as a pure presentation layer.
That positioning matters. In a typical stack, ingestion tools such as Fivetran or Airbyte land raw data, a transformation layer models it, and Superset visualizes the result. Teams already using dbt for data modeling plug Superset directly on top of their marts, because a clean, tested warehouse is what makes self-service dashboards trustworthy. For anyone building broader data analytics skills, understanding this separation of concerns is a common interview theme.
Superset supports more than forty database engines out of the box. The official documentation lists connectors for Snowflake, BigQuery, Postgres, Trino, ClickHouse, and — new in the 2026 releases — MongoDB, both Atlas and self-hosted.
Building Data Analytics Dashboards with the Explore View
Every chart in Superset starts from a dataset. A dataset is either a physical table registered from a connected database or a virtual dataset: a saved SQL query that Superset treats as a table. Virtual datasets are the pragmatic entry point, because they let an analyst shape the data without owning DDL permissions on the warehouse.
The example below defines a virtual dataset that pre-aggregates monthly active users. Registering this query once means every downstream chart inherits the same definition of an active user, which is exactly how a semantic layer prevents metric drift across a team.
-- monthly_active_users.sql (virtual dataset)
SELECT
  date_trunc('month', event_date) AS activity_month,
  plan_tier,
  count(DISTINCT user_id)         AS active_users,
  count(*)                        AS total_events
FROM analytics.fct_events
WHERE event_date >= current_date - interval '24 months'
GROUP BY 1, 2
ORDER BY 1;
Once the dataset exists, the Explore view turns columns into dimensions and aggregations into metrics. An analyst drops activity_month on the x-axis, active_users as the metric, and plan_tier as the series — no SQL required for the chart itself. Metrics can also be defined at the dataset level as saved SQL expressions, so business logic like count(DISTINCT user_id) is written once and reused everywhere.
Charts are then arranged onto a dashboard, where native filters propagate a single control — a date range, a region selector — across every chart on the page. Cross-filtering takes this further: clicking a bar in one chart filters the rest of the dashboard to that value, turning a static report into an exploratory tool. Superset ships more than fifty visualization types, from time-series and pivot tables to deck.gl geospatial layers, and the ECharts-based renderers introduced in recent releases handle large result sets without freezing the browser.
Superset 6.0 added a hierarchical folder system for datasets, letting teams group related metrics and columns instead of scrolling a flat list. It also delivered a complete design overhaul on Ant Design v5 with first-class dark mode, which is the most visible change for anyone returning to the tool after an older 3.x deployment.
Because every chart runs live SQL, dashboard latency is dominated by the warehouse and the cache. Superset caches results in Redis with a configurable timeout, and thumbnail plus dashboard caching warm frequently viewed pages. Tuning cache timeouts per dataset — long for daily snapshots, short for near-real-time tables — is the single most effective performance lever.
SQL Lab and Jinja Templating: Superset's Power Feature
SQL Lab is the built-in SQL IDE, and it is where Superset separates itself from point-and-click tools. It offers autocomplete against connected schemas, asynchronous execution for long-running queries, query history, and one-click conversion of any result set into a chart or a virtual dataset.
The feature that dominates interviews is Jinja templating. Superset injects context-aware macros into queries before they run, which allows a single query to adapt to dashboard filters, the current user, or a time range. Referencing a template variable such as {{ current_username() }} or {{ filter_values('country') }} in prose requires care, but inside a query the macros expand at execution time.
-- revenue_by_segment.sql (SQL Lab with Jinja)
SELECT
  segment,
  sum(amount) AS revenue
FROM analytics.fct_orders
WHERE order_date BETWEEN '{{ from_dttm }}' AND '{{ to_dttm }}'
  {% if filter_values('country') %}
    AND country IN ({{ "'" + "','".join(filter_values('country')) + "'" }})
  {% endif %}
GROUP BY segment
ORDER BY revenue DESC;
Here from_dttm and to_dttm bind to the dashboard time range, while filter_values('country') reads whatever the user selected in a native filter, injecting the values only when a selection exists. This is how one saved query powers a fully interactive dashboard. The macros build on the standard Jinja templating engine, extended with Superset-specific helpers documented in the project.
Jinja also enables row-level security expressions and reusable macros stored in the config. A team can define a macro once — say, a standard fiscal-year boundary or a tenant filter — and call it from any query, keeping business rules consistent across dozens of datasets. Because SQL Lab persists query history and lets any result become a saved query, it doubles as a lightweight versioned scratchpad before logic is promoted to a virtual dataset or pushed upstream into the warehouse. Analysts comfortable with SQL window functions will find SQL Lab a natural place to prototype the complex queries that later become virtual datasets.
Superset vs Tableau: Open Source Against Enterprise BI
The most frequent evaluation question is Superset vs Tableau. The two tools solve the same problem from opposite philosophies: Tableau is a polished commercial product with a desktop authoring app and per-seat pricing, while Superset is a self-hosted web application with no license cost and full source access.
| Dimension | Apache Superset | Tableau |
|---|---|---|
| Licensing | Free, Apache 2.0 | Per-user subscription |
| Deployment | Self-hosted (Docker, Kubernetes) | Cloud or Server |
| Data model | Live SQL, no extract engine | VizQL with in-memory extracts |
| Customization | Full source, plugin charts | Closed, extension API |
| Offline authoring | Browser only | Tableau Desktop |
| Governance | RBAC, row-level security | Enterprise governance suite |
Superset wins on cost, transparency, and warehouse-native execution, which suits teams with SQL fluency and a modern cloud warehouse. Tableau retains an edge in drag-and-drop authoring, blending heterogeneous sources, and mature enterprise governance. The same trade-off framing applies to the Power BI versus Tableau decision: open, warehouse-native tools reward SQL skill, while commercial suites reward polish and support. For a warehouse-first organization, Superset is frequently the stronger long-term bet.
Ready to ace your Data Analytics interviews?
Practice with our interactive simulators, flashcards, and technical tests.
Configuring Apache Superset for Production
Superset is configured through a superset_config.py file that overrides defaults. Feature flags toggle capabilities, and caching plus async query settings determine whether the deployment survives real traffic. The snippet below shows a realistic production baseline.
# superset_config.py
import os

SECRET_KEY = os.environ["SUPERSET_SECRET_KEY"]  # rotate, never commit
SQLALCHEMY_DATABASE_URI = os.environ["METADATA_DB_URI"]

FEATURE_FLAGS = {
    "DASHBOARD_RBAC": True,        # per-dashboard role access
    "ALERT_REPORTS": True,         # scheduled email/Slack reports
    "EMBEDDED_SUPERSET": True,     # embed dashboards via SDK
}

# Redis-backed result and metadata caching
CACHE_CONFIG = {
    "CACHE_TYPE": "RedisCache",
    "CACHE_DEFAULT_TIMEOUT": 300,
    "CACHE_REDIS_URL": os.environ["REDIS_URL"],
}

# Celery handles async SQL Lab queries and alerts
class CeleryConfig:
    broker_url = os.environ["REDIS_URL"]
    result_backend = os.environ["REDIS_URL"]

CELERY_CONFIG = CeleryConfig
Security is layered. Role-based access control ships out of the box, and Superset 6.0 added user group-based access, so roles attach to groups rather than individuals. Row-level security rules append a WHERE clause to every query a user runs against a dataset, which enforces tenant isolation without duplicating dashboards.
Superset refuses to start in recent versions if SECRET_KEY is left at its documented default. Always supply a strong, environment-injected key and rotate it with the superset re-encrypt-secrets command. A leaked key exposes every stored database credential in the metadata store.
Deployment usually runs through the official Docker images or a Helm chart on Kubernetes, with the metadata database, Redis, and Celery workers as separate services. The source repository and the 6.0 release notes document the reference architecture and upgrade path in detail.
Apache Superset Interview Questions
Data analyst and analytics engineering interviews increasingly probe Superset directly. The questions below reflect what hiring teams actually ask in 2026.
How does Superset differ from a traditional BI tool that extracts data? Superset queries the source database live on every chart render and caches results in Redis; it has no proprietary extract engine. This keeps dashboards fresh but pushes load onto the warehouse, so performance depends on the underlying tables and caching strategy.
What is a virtual dataset, and when should one be used? A virtual dataset is a saved SQL query treated as a table. It suits analysts who need to shape data without warehouse DDL rights, or who want a reusable metric definition. For heavy transformations, a modeled table (built with dbt) is preferable, because virtual datasets run their full SQL on every query.
How does Jinja templating make a query dynamic? Macros expand before execution. The example below returns per-user data by binding to the session identity, a pattern that also underpins row-level security.
-- user_scoped_orders.sql
SELECT order_id, amount, status
FROM analytics.fct_orders
WHERE owner_email = '{{ current_username() }}'
ORDER BY order_date DESC;
How is multi-tenant isolation enforced? Row-level security rules attach a filter clause to a dataset per role, so the same dashboard shows each tenant only its own rows. Combined with dashboard-level RBAC, this avoids maintaining one dashboard per customer.
How would a slow dashboard be diagnosed? Start by isolating the slowest chart in SQL Lab and reading the query plan on the warehouse. Common culprits are virtual datasets running heavy joins on every render, missing warehouse partitions, and cache timeouts set too low. Fixes range from materializing the dataset upstream in dbt to raising the cache timeout and adding warehouse indexes or clustering keys.
What are Alert and Report features used for? With the ALERT_REPORTS flag and Celery beat, Superset sends scheduled dashboard snapshots by email or Slack, and alerts fire when a metric crosses a threshold. This covers most operational monitoring without a separate tool, which is a frequent follow-up once dashboards are in place.
When is Superset the wrong choice? When a team has no SQL fluency, needs offline desktop authoring, or requires the governance and vendor support of an enterprise suite. Superset assumes a SQL-literate team and a warehouse worth querying.
Conclusion
Apache Superset in 2026 is a mature, warehouse-native BI platform that rewards SQL skill with cost-free, fully customizable analytics. Key takeaways:
- Treat Superset as a presentation layer over a well-modeled warehouse, not a data store of its own.
- Use virtual datasets and dataset-level metrics to define business logic once and reuse it across charts.
- Master SQL Lab and Jinja templating — dynamic queries and row-level security are the highest-leverage Superset skills.
- Choose Superset over Tableau when SQL fluency, warehouse-native execution, and zero licensing cost outweigh drag-and-drop authoring.
- Lock down production with an injected
SECRET_KEY, Redis caching, Celery workers, and group-based RBAC before exposing dashboards.
Start practicing!
Test your knowledge with our interview simulators and technical tests.
Can you spot the bug in Data Analytics?
One real snippet, one hidden bug, one attempt a day. No account needed to try.

Written by
Anthony Fillion-MailletFounder of SharpSkill
Full-stack developer for over 10 years. Runs SharpSkill and answers for everything published here.
Updated on July 6, 2026
Tags
Share
Related articles
Looker and LookML in 2026: Business Intelligence and Interview Questions
Master LookML modeling, derived tables, and Looker interview questions. Covers semantic layer architecture, PDTs, Liquid templating, and performance optimization for data analysts.
Data Analyst Interview Questions Italy 2026: SQL, Python and Analytics
Prepare for data analyst interviews in Italy with 30 essential questions covering SQL, Python, and business analytics. Includes expected answers for 2026 job market.
dbt for Data Analysts in 2026: Modeling, Testing and Interview Questions
Master dbt (data build tool) for data analytics — project structure, SQL modeling, testing strategies, and common interview questions with practical examples.