Spring Boot Actuator: Micrometer와 Prometheus로 구현하는 운영 모니터링
운영 모니터링을 위한 Spring Boot Actuator 완전 가이드입니다. Micrometer 설정, Prometheus 지표, 커스텀 엔드포인트, 알림 구성을 다룹니다.
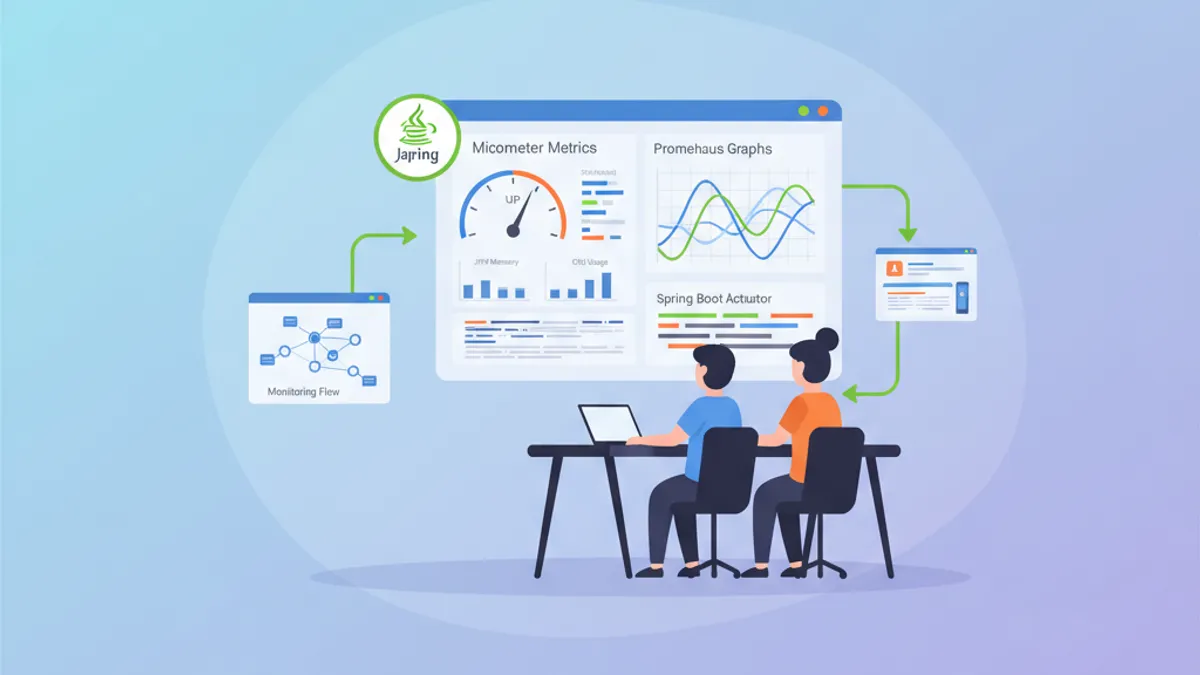
Spring Boot Actuator는 헬스 체크, 지표, 진단을 위한 운영 환경용 엔드포인트를 제공함으로써 자바 애플리케이션의 모니터링 방식을 재정의합니다. Micrometer 및 Prometheus와 결합하면 운영 환경을 위한 완성도 높은 옵저버빌리티 솔루션이 완성됩니다.
Actuator는 별도의 추가 설정 없이 50가지가 넘는 JVM 및 애플리케이션 지표를 자동으로 노출합니다. Micrometer는 이러한 지표를 Prometheus, Grafana, Datadog 등 어떤 모니터링 시스템으로도 전달할 수 있도록 도와주는 파사드 역할을 합니다.
Spring Boot 3 기반의 기본 설정
필요한 Maven 의존성
Actuator와 Prometheus를 통합하려면 세 가지 핵심 의존성이 필요합니다. Actuator 스타터는 엔드포인트를 활성화하고, Micrometer는 지표 추상화를 제공하며, Prometheus 레지스트리는 스크래핑을 위해 데이터를 포맷팅합니다.
<!-- pom.xml -->
<!-- Actuator + Micrometer + Prometheus Configuration -->
<dependencies>
    <!-- Spring Boot Actuator - monitoring endpoints -->
    <dependency>
        <groupId>org.springframework.boot</groupId>
        <artifactId>spring-boot-starter-actuator</artifactId>
    </dependency>

    <!-- Micrometer Registry Prometheus -->
    <!-- Exposes metrics in Prometheus format -->
    <dependency>
        <groupId>io.micrometer</groupId>
        <artifactId>micrometer-registry-prometheus</artifactId>
    </dependency>

    <!-- AOP for @Timed and @Counted metrics -->
    <dependency>
        <groupId>org.springframework.boot</groupId>
        <artifactId>spring-boot-starter-aop</artifactId>
    </dependency>
</dependencies>
이 의존성만 추가해도 Prometheus가 주기적으로 호출할 수 있는 /actuator/prometheus 엔드포인트가 노출됩니다.
Actuator 엔드포인트 설정
기본적으로 HTTP로 노출되는 엔드포인트는 health와 info뿐입니다. 명시적인 설정을 통해 운영 환경에서 어떤 엔드포인트를 유지할지 제어합니다.
# application.yml
# Actuator configuration for production
management:
  endpoints:
    web:
      exposure:
        # Endpoints exposed over HTTP
        # health, info, prometheus are minimum for monitoring
        include: health,info,prometheus,metrics,env,loggers
      base-path: /actuator
    # Disable unused endpoints to reduce attack surface
    enabled-by-default: false
  endpoint:
    # Enable each required endpoint individually
    health:
      enabled: true
      show-details: when-authorized
      show-components: when-authorized
    info:
      enabled: true
    prometheus:
      enabled: true
    metrics:
      enabled: true
    env:
      enabled: true
      # Mask sensitive values
      show-values: when-authorized
    loggers:
      enabled: true
show-details: when-authorized 옵션은 적절한 권한을 가진 인증 사용자에게만 헬스 상세 정보를 노출합니다.
// Securing Actuator endpoints
package com.example.monitoring.config;

import org.springframework.boot.actuate.autoconfigure.security.servlet.EndpointRequest;
import org.springframework.context.annotation.Bean;
import org.springframework.context.annotation.Configuration;
import org.springframework.security.config.annotation.web.builders.HttpSecurity;
import org.springframework.security.web.SecurityFilterChain;

@Configuration
public class ActuatorSecurityConfig {

    @Bean
    SecurityFilterChain actuatorSecurityFilterChain(HttpSecurity http) throws Exception {
        return http
            .securityMatcher(EndpointRequest.toAnyEndpoint())
            .authorizeHttpRequests(auth -> auth
                // Health and info public for load balancers
                .requestMatchers(EndpointRequest.to("health", "info")).permitAll()
                // Prometheus accessible from internal network
                .requestMatchers(EndpointRequest.to("prometheus")).hasIpAddress("10.0.0.0/8")
                // Other endpoints restricted to admins
                .anyRequest().hasRole("ACTUATOR_ADMIN")
            )
            .httpBasic(basic -> {})
            .build();
    }
}
이 설정은 기본 엔드포인트는 공개하면서도 민감한 엔드포인트는 보호합니다.
Micrometer로 만드는 커스텀 지표
애플리케이션 카운터와 게이지
Micrometer는 사용 사례에 맞는 다양한 지표 유형을 제공합니다. Counter는 누적 이벤트, Gauge는 순간 값, Timer는 작업의 소요 시간을 측정합니다.
// Custom business metrics service
package com.example.monitoring.metrics;

import io.micrometer.core.instrument.Counter;
import io.micrometer.core.instrument.Gauge;
import io.micrometer.core.instrument.MeterRegistry;
import io.micrometer.core.instrument.Timer;
import org.springframework.stereotype.Service;

import java.util.concurrent.atomic.AtomicInteger;
import java.util.function.Supplier;

@Service
public class OrderMetricsService {

    // Counter for orders created with status tag
    private final Counter ordersCreatedCounter;
    // Timer to measure processing duration
    private final Timer orderProcessingTimer;
    // Atomic value for pending orders gauge
    private final AtomicInteger pendingOrdersCount = new AtomicInteger(0);

    public OrderMetricsService(MeterRegistry registry) {
        // Counter with tags for filtering in Prometheus
        this.ordersCreatedCounter = Counter.builder("orders.created.total")
            .description("Total number of orders created")
            .tag("application", "order-service")
            .register(registry);

        // Timer with histogram for percentiles
        this.orderProcessingTimer = Timer.builder("orders.processing.duration")
            .description("Order processing duration")
            .publishPercentiles(0.5, 0.95, 0.99)
            .publishPercentileHistogram()
            .register(registry);

        // Gauge linked to atomic value
        // Updates automatically on each scrape
        Gauge.builder("orders.pending.count", pendingOrdersCount, AtomicInteger::get)
            .description("Number of orders pending processing")
            .register(registry);
    }

    public void recordOrderCreated() {
        ordersCreatedCounter.increment();
        pendingOrdersCount.incrementAndGet();
    }

    public void recordOrderProcessed(Runnable processingLogic) {
        // Automatically measures execution duration
        orderProcessingTimer.record(processingLogic);
        pendingOrdersCount.decrementAndGet();
    }

    public <T> T recordOrderProcessedWithResult(Supplier<T> processingLogic) {
        return orderProcessingTimer.record(processingLogic);
    }
}
태그를 활용하면 Prometheus에서 PromQL 질의로 지표를 정밀하게 필터링하고 집계할 수 있습니다.
@Timed와 @Counted 애노테이션
반복적인 코드를 줄이기 위해 Micrometer는 메서드를 자동으로 계측해 주는 AOP 애노테이션을 제공합니다.
// Automatic instrumentation with annotations
package com.example.monitoring.service;

import io.micrometer.core.annotation.Counted;
import io.micrometer.core.annotation.Timed;
import org.springframework.stereotype.Service;

@Service
public class PaymentService {

    // @Timed automatically creates a Timer
    // Measures each call and publishes count, sum, max
    @Timed(
        value = "payment.process.duration",
        description = "Payment processing duration",
        percentiles = {0.5, 0.95, 0.99},
        histogram = true
    )
    public PaymentResult processPayment(PaymentRequest request) {
        // Payment logic
        validatePayment(request);
        return executePayment(request);
    }

    // @Counted increments a counter on each call
    // Useful for discrete events
    @Counted(
        value = "payment.refunds.total",
        description = "Total number of refunds"
    )
    public void refundPayment(String transactionId) {
        // Refund logic
    }

    // Combining both annotations
    @Timed(value = "payment.validation.duration")
    @Counted(value = "payment.validation.total")
    private void validatePayment(PaymentRequest request) {
        // Payment validation
    }
}// Required configuration to enable @Timed
package com.example.monitoring.config;
import io.micrometer.core.aop.CountedAspect;
import io.micrometer.core.aop.TimedAspect;
import io.micrometer.core.instrument.MeterRegistry;
import org.springframework.context.annotation.Bean;
import org.springframework.context.annotation.Configuration;
@Configuration
public class TimedAspectConfig {
// Aspect required for @Timed to work
@Bean
TimedAspect timedAspect(MeterRegistry registry) {
return new TimedAspect(registry);
}
// Aspect for @Counted
@Bean
CountedAspect countedAspect(MeterRegistry registry) {
return new CountedAspect(registry);
}
}@Timed와 @Counted 애노테이션은 Spring 빈과 외부 호출에서만 동작합니다. 동일 클래스 내부의 호출은 AOP 프록시를 우회하므로 계측되지 않습니다.
Spring Boot 면접 준비가 되셨나요?
인터랙티브 시뮬레이터, flashcards, 기술 테스트로 연습하세요.
커스텀 헬스 엔드포인트
비즈니스 Health Indicator
Health Indicator는 외부 의존성과 핵심 비즈니스 컴포넌트의 상태를 점검합니다. Spring Boot는 데이터베이스, Redis 등 자주 사용되는 서비스에 대한 기본 인디케이터를 제공합니다.
// Health indicator for payment gateway
package com.example.monitoring.health;

import org.springframework.boot.actuate.health.Health;
import org.springframework.boot.actuate.health.HealthIndicator;
import org.springframework.stereotype.Component;
import org.springframework.web.client.RestClient;

import java.time.Duration;
import java.time.Instant;

@Component
public class PaymentGatewayHealthIndicator implements HealthIndicator {

    private final RestClient restClient;
    private final String gatewayHealthUrl;

    public PaymentGatewayHealthIndicator(RestClient.Builder restClientBuilder) {
        this.restClient = restClientBuilder.build();
        this.gatewayHealthUrl = "https://api.payment-gateway.com/health";
    }

    @Override
    public Health health() {
        Instant start = Instant.now();

        try {
            // Call gateway health endpoint
            var response = restClient.get()
                .uri(gatewayHealthUrl)
                .retrieve()
                .toBodilessEntity();

            Duration responseTime = Duration.between(start, Instant.now());

            if (response.getStatusCode().is2xxSuccessful()) {
                return Health.up()
                    .withDetail("responseTime", responseTime.toMillis() + "ms")
                    .withDetail("statusCode", response.getStatusCode().value())
                    .build();
            } else {
                return Health.down()
                    .withDetail("statusCode", response.getStatusCode().value())
                    .withDetail("reason", "Unexpected status code")
                    .build();
            }
        } catch (Exception e) {
            Duration responseTime = Duration.between(start, Instant.now());

            return Health.down()
                .withDetail("error", e.getClass().getSimpleName())
                .withDetail("message", e.getMessage())
                .withDetail("responseTime", responseTime.toMillis() + "ms")
                .build();
        }
    }
}
이 인디케이터는 자동으로 /actuator/health 아래 paymentGateway라는 이름으로 노출됩니다.
Kubernetes를 위한 헬스 그룹
헬스 그룹을 사용하면 Kubernetes의 liveness 및 readiness 프로브용 엔드포인트를 분리해 만들 수 있습니다.
# application.yml
# Health groups configuration for Kubernetes
management:
  endpoint:
    health:
      group:
        # Liveness probe - is the application alive?
        liveness:
          include: livenessState
          show-details: always
        # Readiness probe - can the application receive traffic?
        readiness:
          include: readinessState,db,redis,paymentGateway
          show-details: always
        # Custom probe for critical dependencies
        critical:
          include: db,paymentGateway
          show-details: when-authorized
  health:
    # Enable Kubernetes states
    livenessstate:
      enabled: true
    readinessstate:
enabled: true// Programmatic health groups configuration
package com.example.monitoring.config;
import org.springframework.boot.actuate.availability.LivenessStateHealthIndicator;
import org.springframework.boot.actuate.availability.ReadinessStateHealthIndicator;
import org.springframework.boot.availability.ApplicationAvailability;
import org.springframework.context.annotation.Bean;
import org.springframework.context.annotation.Configuration;
@Configuration
public class KubernetesHealthConfig {
@Bean
LivenessStateHealthIndicator livenessStateHealthIndicator(
ApplicationAvailability availability) {
return new LivenessStateHealthIndicator(availability);
}
@Bean
ReadinessStateHealthIndicator readinessStateHealthIndicator(
ApplicationAvailability availability) {
return new ReadinessStateHealthIndicator(availability);
}
}Kubernetes 프로브는 이렇게 구성된 전용 엔드포인트를 가리킵니다.
# kubernetes-deployment.yml
# Kubernetes probes configuration
spec:
  containers:
    - name: order-service
      livenessProbe:
        httpGet:
          path: /actuator/health/liveness
          port: 8080
        initialDelaySeconds: 30
        periodSeconds: 10
        failureThreshold: 3
      readinessProbe:
        httpGet:
          path: /actuator/health/readiness
          port: 8080
        initialDelaySeconds: 10
        periodSeconds: 5
        failureThreshold: 3
Prometheus와 Grafana 통합
Prometheus 스크래핑 설정
Prometheus는 /actuator/prometheus 엔드포인트를 주기적으로 호출하여 지표를 수집합니다. 설정 파일에서 스크래핑 대상을 정의합니다.
# prometheus.yml
# Prometheus configuration for Spring Boot
global:
  scrape_interval: 15s
  evaluation_interval: 15s

scrape_configs:
  - job_name: 'spring-boot-apps'
    metrics_path: '/actuator/prometheus'
    scrape_interval: 10s
    static_configs:
      - targets:
          - 'order-service:8080'
          - 'payment-service:8080'
          - 'inventory-service:8080'
    # Relabeling to add metadata
    relabel_configs:
      - source_labels: [__address__]
        target_label: instance
        regex: '([^:]+):\d+'
        replacement: '${1}'

  # Kubernetes service discovery
  - job_name: 'kubernetes-pods'
    kubernetes_sd_configs:
      - role: pod
    relabel_configs:
      # Only scrape pods with annotation
      - source_labels: [__meta_kubernetes_pod_annotation_prometheus_io_scrape]
        action: keep
        regex: true
      - source_labels: [__meta_kubernetes_pod_annotation_prometheus_io_path]
        action: replace
        target_label: __metrics_path__
        regex: (.+)
기본 JVM 지표
Micrometer와 결합된 Actuator는 상세한 JVM 지표를 자동으로 노출합니다. 모니터링에서 가장 중요하게 활용되는 항목은 다음과 같습니다.
# PromQL queries for JVM monitoring

# Heap memory usage
jvm_memory_used_bytes{area="heap"}

# Memory usage percentage
jvm_memory_used_bytes{area="heap"} / jvm_memory_max_bytes{area="heap"} * 100

# Active threads
jvm_threads_live_threads

# Garbage collection - time spent
rate(jvm_gc_pause_seconds_sum[5m])

# GC count per minute
rate(jvm_gc_pause_seconds_count[1m]) * 60

# CPU used by JVM
process_cpu_usage

# Active database connections
hikaricp_connections_active

# Connection pool utilization
hikaricp_connections_active / hikaricp_connections_max * 100// Additional JVM metrics
package com.example.monitoring.metrics;
import io.micrometer.core.instrument.Gauge;
import io.micrometer.core.instrument.MeterRegistry;
import io.micrometer.core.instrument.binder.MeterBinder;
import org.springframework.stereotype.Component;
import java.lang.management.ManagementFactory;
import java.lang.management.OperatingSystemMXBean;
@Component
public class CustomJvmMetrics implements MeterBinder {
@Override
public void bindTo(MeterRegistry registry) {
OperatingSystemMXBean osBean = ManagementFactory.getOperatingSystemMXBean();
// System load average
Gauge.builder("system.load.average", osBean, OperatingSystemMXBean::getSystemLoadAverage)
.description("System load average over 1 minute")
.register(registry);
// Available processors count
Gauge.builder("system.cpu.count", osBean, OperatingSystemMXBean::getAvailableProcessors)
.description("Number of available processors")
.register(registry);
// Application uptime
Gauge.builder("application.uptime.seconds",
ManagementFactory.getRuntimeMXBean(),
bean -> bean.getUptime() / 1000.0)
.description("Application uptime in seconds")
.register(registry);
}
}즉시 활용 가능한 Grafana 대시보드
Grafana는 Spring Boot용으로 사전 구성된 대시보드를 제공합니다. 대시보드 ID 12900을 사용하면 Actuator 지표 전반을 한눈에 살펴볼 수 있습니다.
{
  "annotations": {
    "list": []
  },
  "panels": [
    {
      "title": "Request Rate",
      "type": "graph",
      "targets": [
        {
          "expr": "rate(http_server_requests_seconds_count{application=\"$application\"}[5m])",
          "legendFormat": "{{method}} {{uri}} - {{status}}"
        }
      ]
    },
    {
      "title": "Response Time P99",
      "type": "graph",
      "targets": [
        {
          "expr": "histogram_quantile(0.99, rate(http_server_requests_seconds_bucket{application=\"$application\"}[5m]))",
          "legendFormat": "{{method}} {{uri}}"
        }
      ]
    },
    {
      "title": "Error Rate",
      "type": "singlestat",
      "targets": [
        {
          "expr": "sum(rate(http_server_requests_seconds_count{application=\"$application\",status=~\"5..\"}[5m])) / sum(rate(http_server_requests_seconds_count{application=\"$application\"}[5m])) * 100"
        }
      ]
    }
  ]
}대시보드 가져오는 방법은 다음과 같습니다. Grafana → Dashboards → Import → ID 12900 (Spring Boot Statistics) 또는 4701 (JVM Micrometer). 두 대시보드 모두 Actuator의 표준 지표와 바로 연동됩니다.
Prometheus 알림 구성
핵심 알림 규칙
Prometheus 알림 규칙은 지표가 임곗값을 넘는 순간 알림을 발송합니다.
# alerting-rules.yml
# Alert rules for Spring Boot applications
groups:
  - name: spring-boot-alerts
    rules:
      # Alert if application is down
      - alert: ApplicationDown
        expr: up{job="spring-boot-apps"} == 0
        for: 1m
        labels:
          severity: critical
        annotations:
          summary: "Application {{ $labels.instance }} is down"
          description: "{{ $labels.instance }} has been down for more than 1 minute"

      # Alert on HTTP error rate
      - alert: HighErrorRate
        expr: |
          sum(rate(http_server_requests_seconds_count{status=~"5.."}[5m])) by (application)
          /
          sum(rate(http_server_requests_seconds_count[5m])) by (application)
          > 0.05
        for: 5m
        labels:
          severity: warning
        annotations:
          summary: "High error rate on {{ $labels.application }}"
          description: "Error rate is {{ $value | humanizePercentage }}"

      # Alert on P99 latency
      - alert: HighLatency
        expr: |
          histogram_quantile(0.99,
            rate(http_server_requests_seconds_bucket[5m])
          ) > 2
        for: 5m
        labels:
          severity: warning
        annotations:
          summary: "High latency detected"
          description: "P99 latency is {{ $value | humanizeDuration }}"

      # Heap memory alert
      - alert: HighHeapUsage
        expr: |
          jvm_memory_used_bytes{area="heap"}
          / jvm_memory_max_bytes{area="heap"}
          > 0.85
        for: 5m
        labels:
          severity: warning
        annotations:
          summary: "High heap memory usage on {{ $labels.instance }}"
          description: "Heap usage is at {{ $value | humanizePercentage }}"

      # Database connection pool exhausted alert
      - alert: DatabaseConnectionPoolExhausted
        expr: |
          hikaricp_connections_active
          / hikaricp_connections_max
          > 0.9
        for: 2m
        labels:
          severity: critical
        annotations:
          summary: "Database connection pool nearly exhausted"
          description: "{{ $value | humanizePercentage }} of connections in use"

      # Excessive GC alert
      - alert: HighGCPause
        expr: |
          rate(jvm_gc_pause_seconds_sum[5m])
          / rate(jvm_gc_pause_seconds_count[5m])
          > 0.5
        for: 5m
        labels:
          severity: warning
        annotations:
          summary: "High GC pause time"
          description: "Average GC pause is {{ $value | humanizeDuration }}"
이러한 알림은 운영에서 자주 마주치는 가용성, 성능, 자원 관련 문제를 폭넓게 다룹니다.
HTTP와 데이터베이스 지표
HTTP 요청의 자동 계측
Spring Boot 3은 들어오는 모든 HTTP 요청에 대해 상세한 지표를 자동으로 수집합니다.
# application.yml
# HTTP metrics configuration
management:
  metrics:
    distribution:
      # Enable histograms for percentiles
      percentiles-histogram:
        http.server.requests: true
      percentiles:
        http.server.requests: 0.5, 0.75, 0.95, 0.99
      # Define SLA buckets
      slo:
        http.server.requests: 100ms, 500ms, 1s, 2s
    tags:
      # Global tags added to all metrics
      application: ${spring.application.name}
environment: ${spring.profiles.active:default}// HTTP tags customization
package com.example.monitoring.config;
import io.micrometer.core.instrument.Tag;
import org.springframework.boot.actuate.metrics.web.servlet.WebMvcTagsContributor;
import org.springframework.context.annotation.Bean;
import org.springframework.context.annotation.Configuration;
import org.springframework.web.servlet.HandlerMapping;
import jakarta.servlet.http.HttpServletRequest;
import jakarta.servlet.http.HttpServletResponse;
import java.util.Collections;
@Configuration
public class WebMvcMetricsConfig {
@Bean
WebMvcTagsContributor customTagsContributor() {
return (request, response, handler, exception) -> {
// Add custom tags to HTTP metrics
String userId = request.getHeader("X-User-Id");
String tenantId = request.getHeader("X-Tenant-Id");
return java.util.List.of(
Tag.of("user.type", userId != null ? "authenticated" : "anonymous"),
Tag.of("tenant", tenantId != null ? tenantId : "default")
);
};
}
}HikariCP와 SQL 쿼리 지표
HikariCP 커넥션 풀 지표는 자동으로 노출됩니다. SQL 쿼리에 대해서는 추가 설정으로 쿼리 시간 추적을 활성화할 수 있습니다.
# application.yml
# HikariCP configuration with metrics
spring:
  datasource:
    hikari:
      pool-name: OrderServicePool
      maximum-pool-size: 20
      minimum-idle: 5
      connection-timeout: 30000
      idle-timeout: 600000
      max-lifetime: 1800000
      # Enable detailed metrics
register-mbeans: true// Additional metrics for SQL queries
package com.example.monitoring.config;
import io.micrometer.core.instrument.MeterRegistry;
import net.ttddyy.dsproxy.listener.logging.SLF4JLogLevel;
import net.ttddyy.dsproxy.support.ProxyDataSourceBuilder;
import org.springframework.beans.factory.annotation.Qualifier;
import org.springframework.boot.autoconfigure.jdbc.DataSourceProperties;
import org.springframework.context.annotation.Bean;
import org.springframework.context.annotation.Configuration;
import org.springframework.context.annotation.Primary;
import javax.sql.DataSource;
@Configuration
public class DataSourceMetricsConfig {
@Bean
@Primary
DataSource metricsDataSource(
DataSourceProperties properties,
MeterRegistry registry) {
// Original DataSource
DataSource originalDataSource = properties
.initializeDataSourceBuilder()
.build();
// Proxy with metrics
return ProxyDataSourceBuilder.create(originalDataSource)
.name("order-service-db")
.listener(new MicrometerQueryMetricsListener(registry))
.logQueryBySlf4j(SLF4JLogLevel.DEBUG)
.build();
}
}// Listener for SQL query metrics
package com.example.monitoring.metrics;
import io.micrometer.core.instrument.MeterRegistry;
import io.micrometer.core.instrument.Timer;
import net.ttddyy.dsproxy.ExecutionInfo;
import net.ttddyy.dsproxy.QueryInfo;
import net.ttddyy.dsproxy.listener.QueryExecutionListener;
import java.util.List;
import java.util.concurrent.TimeUnit;
public class MicrometerQueryMetricsListener implements QueryExecutionListener {
private final Timer queryTimer;
public MicrometerQueryMetricsListener(MeterRegistry registry) {
this.queryTimer = Timer.builder("sql.query.duration")
.description("SQL query execution duration")
.publishPercentiles(0.5, 0.95, 0.99)
.register(registry);
}
@Override
public void beforeQuery(ExecutionInfo execInfo, List<QueryInfo> queryInfoList) {
// Before execution
}
@Override
public void afterQuery(ExecutionInfo execInfo, List<QueryInfo> queryInfoList) {
// Record duration for each query
long elapsedTime = execInfo.getElapsedTime();
queryTimer.record(elapsedTime, TimeUnit.MILLISECONDS);
}
}운영을 위한 모범 사례
지표 카디널리티
카디널리티가 지나치게 높으면 Prometheus 성능이 떨어집니다. 태그의 모든 고유 조합이 별개의 시계열을 만들어 내기 때문입니다.
// ❌ AVOID - Explosive cardinality
package com.example.monitoring.antipattern;

@Service
public class AntiPatternHighCardinality {

    private final MeterRegistry registry;

    // ❌ BAD: userId creates one series per user
    public void trackUserAction(String userId, String action) {
        Counter.builder("user.actions")
            .tag("userId", userId)  // Millions of possible values!
            .tag("action", action)
            .register(registry)
            .increment();
    }
}// ✅ Controlled cardinality
package com.example.monitoring.bestpractice;
@Service
public class GoodPracticeCardinality {
private final MeterRegistry registry;
// ✅ GOOD: User category instead of ID
public void trackUserAction(User user, String action) {
Counter.builder("user.actions")
.tag("userType", user.getSubscriptionType()) // FREE, PREMIUM, ENTERPRISE
.tag("action", action)
.register(registry)
.increment();
}
// ✅ GOOD: Grouping by range
public void trackResponseTime(long responseTimeMs) {
String bucket = categorizeResponseTime(responseTimeMs);
Counter.builder("response.time.bucket")
.tag("bucket", bucket) // fast, normal, slow, very_slow
.register(registry)
.increment();
}
private String categorizeResponseTime(long ms) {
if (ms < 100) return "fast";
if (ms < 500) return "normal";
if (ms < 2000) return "slow";
return "very_slow";
}
}운영용 설정
# application-production.yml
# Optimized configuration for production
management:
  endpoints:
    web:
      exposure:
        include: health,info,prometheus
  endpoint:
    health:
      show-details: when-authorized
      probes:
        enabled: true
  metrics:
    export:
      prometheus:
        enabled: true
        step: 30s
    distribution:
      percentiles-histogram:
        http.server.requests: true
      minimum-expected-value:
        http.server.requests: 1ms
      maximum-expected-value:
        http.server.requests: 30s
    tags:
      application: ${spring.application.name}
      environment: production
      version: ${app.version:unknown}
  server:
    # Separate port for management endpoints
    port: 9090

# Disable non-essential endpoints in production
  endpoint:
    env:
      enabled: false
    beans:
      enabled: false
    configprops:
      enabled: false
    mappings:
      enabled: false
결론
Micrometer 및 Prometheus와 결합한 Spring Boot Actuator는 완성도 높은 모니터링 솔루션을 제공합니다.
✅ 최소한의 설정 — Spring Boot Starter로 만나는 운영 환경용 엔드포인트
✅ JVM 지표 자동 수집 — 메모리, 스레드, GC, CPU를 추가 코드 없이 수집
✅ 커스텀 지표 — @Timed/@Counted 애노테이션 기반 Counter, Gauge, Timer
✅ Health Indicator — 외부 의존성과 Kubernetes 상태 점검
✅ Prometheus 통합 — 스크래핑과 알림을 위한 표준 포맷
✅ 내장 보안 — 민감 엔드포인트에 대한 접근 제어
✅ Grafana 대시보드 — 사전 구성된 대시보드로 즉시 가시화
✅ 알림 — 운영 환경 이상을 감지하는 PromQL 규칙
이 옵저버빌리티 스택은 Spring Boot 애플리케이션을 자신 있게 운영하기 위한 필수 토대를 제공합니다.
연습을 시작하세요!
면접 시뮬레이터와 기술 테스트로 지식을 테스트하세요.
태그
공유
관련 기사

2026년 Spring Boot 로깅: Logback과 JSON으로 구현하는 운영 환경 구조화 로그
Spring Boot 구조화 로깅 완벽 가이드입니다. Logback JSON 설정, 추적용 MDC, 운영 환경 모범 사례, ELK Stack 연동을 다룹니다.

Spring Kafka: 회복탄력성을 갖춘 컨슈머로 구축하는 이벤트 기반 아키텍처
이벤트 기반 아키텍처를 위한 완전한 Spring Kafka 가이드. 설정, 회복탄력성을 갖춘 컨슈머, 재시도 정책, Dead Letter Queue, 분산 애플리케이션을 위한 운영 패턴.
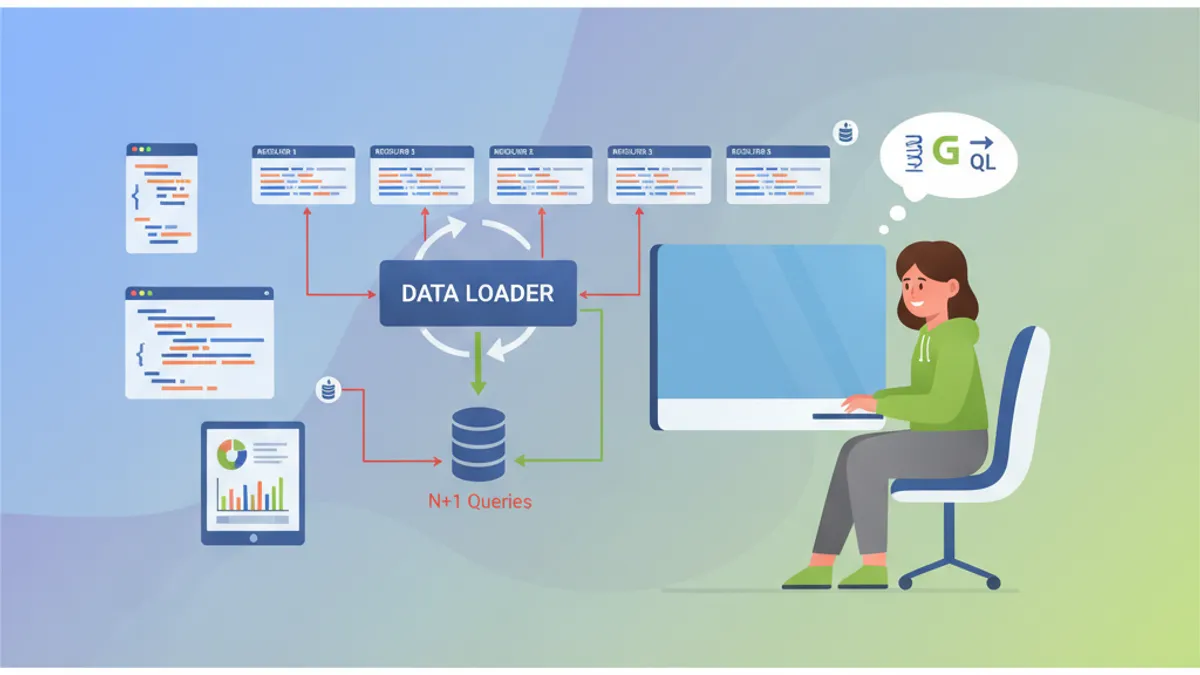
Spring GraphQL 면접: Resolver, DataLoader 및 N+1 문제 해결책
이 완전한 가이드로 Spring GraphQL 면접을 준비합니다. Resolver, DataLoader, N+1 문제 처리, mutation 및 기술 질문을 위한 모범 사례를 다룹니다.