DevOps 인터뷰 필수 질문: 완전 가이드 2026
CI/CD, Kubernetes, Docker, Terraform, SRE 실천에 관한 필수 질문으로 DevOps 인터뷰를 준비하십시오. 상세한 답변 포함.
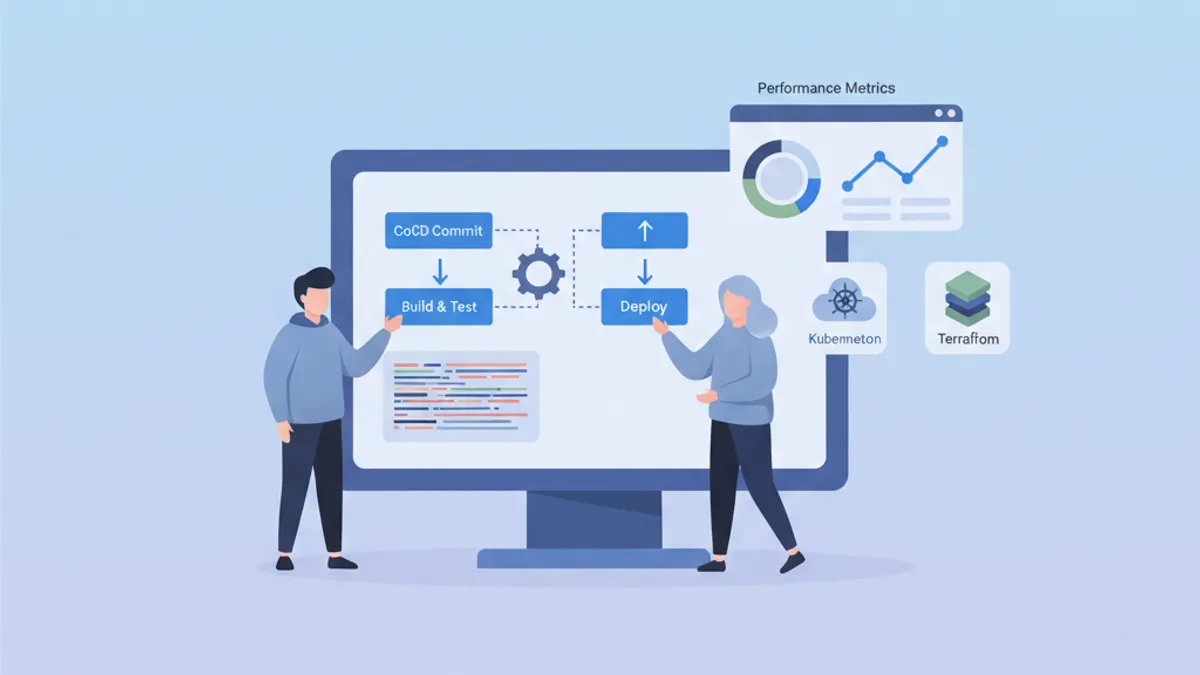
DevOps 인터뷰는 개발, 운영, 자동화 문화 기술의 독특한 조합을 평가합니다. 이 가이드는 도메인별로 정리된 가장 자주 묻는 질문들을 개념에 대한 깊은 숙련도를 보여주는 구조화된 답변과 함께 엮었습니다.
기술적 지식 외에도, 면접관은 복잡한 개념을 간단하게 설명하는 능력과 구체적인 문제 해결 경험을 공유할 수 있는지를 평가합니다.
DevOps 기초와 문화
초기 질문은 DevOps 철학에 대한 전반적인 이해를 평가하는 경우가 많습니다.
Q1: DevOps란 무엇이며 이 접근 방식은 어떤 문제를 해결합니까?
DevOps는 소프트웨어 개발(Dev)과 IT 운영(Ops)을 통합하는 문화와 실천의 집합입니다. 이 접근 방식은 높은 품질을 유지하면서 개발 주기를 단축하는 것을 목표로 합니다.
# devops-principles.yaml
# The pillars of DevOps culture
principles:
  collaboration:
    description: "Breaking silos between teams"
    practices:
      - "Shared responsibility for production code"
      - "Continuous communication via ChatOps"
      - "Blameless post-mortems"

  automation:
    description: "Automate repetitive tasks"
    practices:
      - "Infrastructure as Code (IaC)"
      - "CI/CD pipelines"
      - "Automated testing at all levels"

  measurement:
    description: "Measure to improve"
    metrics:
      - "Deployment frequency"
      - "Lead time for changes"
      - "Mean time to recovery (MTTR)"
      - "Change failure rate"

  sharing:
    description: "Share knowledge"
    practices:
      - "Documentation as Code"
      - "Automated runbooks"
      - "Regular knowledge sharing sessions"
해결되는 문제에는 느리고 위험한 배포, 팀 간 가시성 부족, 환경 간 불일치 등이 포함됩니다.
Q2: CI, CD(Continuous Delivery), CD(Continuous Deployment)의 차이점은 무엇입니까?
이 세 가지 개념은 배포 주기 자동화의 점진적 발전을 형성합니다.
# ci-cd-pipeline-stages.sh
# Illustration of CI/CD stages

# ============================================
# CI (Continuous Integration)
# ============================================
# Goal: Frequently integrate code into a shared repository
# Automation: Build + Tests
echo "CI: Code commit → Build → Unit Tests → Integration Tests"

# ============================================
# CD (Continuous Delivery)
# ============================================
# Goal: Code always deployable to production
# Automation: CI + Staging deployment + Manual approval
echo "CD Delivery: CI → Deploy Staging → Manual Approval → Deploy Prod"

# ============================================
# CD (Continuous Deployment)
# ============================================
# Goal: Automatic deployment to production
# Automation: Entire pipeline without human intervention
echo "CD Deployment: CI → Deploy Staging → Auto Tests → Auto Deploy Prod"
핵심 차이점은 자동화 수준에 있습니다. Continuous Delivery는 프로덕션 배포 전 수동 승인이 필요하지만, Continuous Deployment는 전체 프로세스를 완전히 자동화합니다.
CI/CD와 파이프라인
CI/CD 질문은 배포 파이프라인 설계 및 최적화 능력을 테스트합니다.
Q3: 견고한 CI/CD 파이프라인을 어떻게 구성합니까?
잘 설계된 파이프라인은 각 레벨에 체크포인트가 있는 단계적 스테이지를 따릅니다.
# .gitlab-ci.yml
# Complete CI/CD pipeline with parallel and sequential stages
stages:
  - validate
  - build
  - test
  - security
  - deploy-staging
  - integration-tests
  - deploy-production

variables:
  DOCKER_IMAGE: $CI_REGISTRY_IMAGE:$CI_COMMIT_SHA

# ============================================
# Stage 1: Fast validation (< 2 min)
# ============================================
lint:
  stage: validate
  script:
    - npm run lint
    - npm run type-check
  # Run on every commit
  rules:
    - if: $CI_PIPELINE_SOURCE == "merge_request_event"
    - if: $CI_COMMIT_BRANCH

# ============================================
# Stage 2: Application build
# ============================================
build:
  stage: build
  script:
    - docker build -t $DOCKER_IMAGE .
    - docker push $DOCKER_IMAGE
  # Cache Docker layers to speed up builds
  cache:
    key: docker-$CI_COMMIT_REF_SLUG
    paths:
      - .docker-cache/

# ============================================
# Stage 3: Parallel tests
# ============================================
unit-tests:
  stage: test
  script:
    - npm run test:unit -- --coverage
  coverage: '/Lines\s*:\s*(\d+\.?\d*)%/'
  artifacts:
    reports:
      coverage_report:
        coverage_format: cobertura
        path: coverage/cobertura-coverage.xml

integration-tests:
  stage: test
  services:
    - postgres:16-alpine
    - redis:7-alpine
  script:
    - npm run test:integration
  # Parallelization with unit tests
  parallel: 3

# ============================================
# Stage 4: Security analysis
# ============================================
sast:
  stage: security
  script:
    - trivy image --exit-code 1 --severity HIGH,CRITICAL $DOCKER_IMAGE
  allow_failure: false

dependency-scan:
  stage: security
  script:
    - npm audit --audit-level=high
  allow_failure: true  # Alert without blocking

# ============================================
# Stage 5: Staging deployment
# ============================================
deploy-staging:
  stage: deploy-staging
  script:
    - kubectl set image deployment/app app=$DOCKER_IMAGE -n staging
    - kubectl rollout status deployment/app -n staging --timeout=300s
  environment:
    name: staging
    url: https://staging.example.com
  only:
    - develop

# ============================================
# Stage 6: E2E tests on staging
# ============================================
e2e-tests:
  stage: integration-tests
  script:
    - npm run test:e2e -- --base-url=https://staging.example.com
  artifacts:
    when: on_failure
    paths:
      - cypress/screenshots/
      - cypress/videos/
  only:
    - develop

# ============================================
# Stage 7: Production deployment
# ============================================
deploy-production:
  stage: deploy-production
  script:
    - kubectl set image deployment/app app=$DOCKER_IMAGE -n production
    - kubectl rollout status deployment/app -n production --timeout=300s
  environment:
    name: production
    url: https://app.example.com
  # Manual deployment with protection
  when: manual
  only:
    - main
이 파이프라인은 모범 사례를 보여줍니다: 속도를 위한 병렬 스테이지, 추적성을 위한 아티팩트, 프로덕션을 위한 보호된 환경.
Q4: CI/CD 파이프라인에서 시크릿을 어떻게 관리합니까?
시크릿 관리는 암호화, 교체, 최소 권한 원칙을 결합한 다층 접근이 필요합니다.
# kubernetes-secrets-management.yaml
# Approach 1: External Secrets Operator with HashiCorp Vault
apiVersion: external-secrets.io/v1beta1
kind: ExternalSecret
metadata:
  name: app-secrets
  namespace: production
spec:
  refreshInterval: 1h  # Automatic rotation
  secretStoreRef:
    name: vault-backend
    kind: ClusterSecretStore
  target:
    name: app-secrets
    creationPolicy: Owner
  data:
    # Reference to secret in Vault
    - secretKey: DATABASE_PASSWORD
      remoteRef:
        key: secret/data/production/database
        property: password
    - secretKey: API_KEY
      remoteRef:
        key: secret/data/production/api
        property: key
---
# SecretStore configuration
apiVersion: external-secrets.io/v1beta1
kind: ClusterSecretStore
metadata:
  name: vault-backend
spec:
  provider:
    vault:
      server: "https://vault.example.com"
      path: "secret"
      version: "v2"
      auth:
        kubernetes:
          mountPath: "kubernetes"
          role: "external-secrets"
          # Dedicated ServiceAccount with minimal permissions
          serviceAccountRef:
            name: external-secrets-sa
권장 사례: 코드에 시크릿을 평문으로 저장하지 않기, 전용 시크릿 매니저(Vault, AWS Secrets Manager) 사용, 자동 교체 활성화.
로그에 보이는 CI/CD 환경 변수를 피하십시오. CI 플랫폼의 기본 기능(마스크된 변수)을 사용해 항상 시크릿을 마스킹하십시오.
Kubernetes와 오케스트레이션
Kubernetes 질문은 오케스트레이션 개념에 대한 이해와 구체적인 문제 해결 능력을 평가합니다.
Q5: Kubernetes 아키텍처와 각 컴포넌트의 역할을 설명하십시오.
Kubernetes는 서로 다른 책임을 가진 컴포넌트로 구성된 마스터-노드 아키텍처를 따릅니다.
# kubernetes-architecture.yaml
# Control Plane components (Master)
control_plane:
  api_server:
    role: "Entry point for all API requests"
    responsibilities:
      - "Validation and configuration of API objects"
      - "Authentication and authorization"
      - "REST interface for kubectl and other clients"

  etcd:
    role: "Distributed key-value database"
    responsibilities:
      - "Cluster state storage"
      - "Source of truth for configuration"
      - "Consensus via Raft algorithm"

  scheduler:
    role: "Assigning Pods to nodes"
    responsibilities:
      - "Evaluating constraints (resources, affinity)"
      - "Selecting the optimal node"
      - "Respecting PodDisruptionBudgets"

  controller_manager:
    role: "Control loops for desired state"
    controllers:
      - "ReplicaSet Controller"
      - "Deployment Controller"
      - "Service Controller"
      - "Node Controller"

# Worker Node components
worker_nodes:
  kubelet:
    role: "Agent on each node"
    responsibilities:
      - "Communication with Control Plane"
      - "Pod lifecycle management"
      - "Node status reporting"

  kube_proxy:
    role: "Network proxy on each node"
    responsibilities:
      - "iptables/IPVS rules for Services"
      - "Intra-cluster load balancing"

  container_runtime:
    role: "Container execution"
    options:
      - "containerd (recommended)"
      - "CRI-O"
이 아키텍처는 고가용성을 가능하게 합니다: Control Plane은 복제될 수 있으며, 워크로드는 Worker Node에 분산됩니다.
Q6: 시작하지 않는 Pod를 어떻게 디버그합니까?
Kubernetes 디버깅은 서로 다른 레이어를 분석하는 체계적인 접근 방식을 따릅니다.
# kubernetes-debugging.sh
# Workflow for debugging a failing Pod

# Step 1: Check Pod status
kubectl get pod my-app-pod -o wide
# STATUS: CrashLoopBackOff, ImagePullBackOff, Pending, etc.

# Step 2: Pod details and events
kubectl describe pod my-app-pod
# Important sections:
# - Conditions (PodScheduled, Initialized, Ready)
# - Events (scheduling, pull errors, etc.)

# Step 3: Container logs
kubectl logs my-app-pod --previous  # Previous crash logs
kubectl logs my-app-pod -c init-container  # Init container logs

# Step 4: Interactive execution for debugging
kubectl exec -it my-app-pod -- sh
# Check: env vars, mounted files, network

# Step 5: Check available resources
kubectl describe node <node-name>
# Sections: Allocatable, Allocated resources

# Step 6: Debug with ephemeral Pod (K8s 1.25+)
kubectl debug my-app-pod -it --image=busybox --share-processes
일반적인 원인에는 리소스 부족, 이미지를 찾을 수 없음, 누락된 시크릿, 또는 잘못 구성된 프로브가 포함됩니다.
# pod-debugging-checklist.yaml
# Debugging checklist by status
debugging_by_status:
  Pending:
    causes:
      - "Insufficient resources on nodes"
      - "PersistentVolumeClaim not bound"
      - "Affinity/Taints not satisfied"
    commands:
      - "kubectl describe pod <name> | grep -A 20 Events"
      - "kubectl get pvc"
      - "kubectl describe nodes | grep -A 5 Allocated"

  ImagePullBackOff:
    causes:
      - "Non-existent image or incorrect tag"
      - "Private registry without imagePullSecrets"
      - "Docker Hub rate limiting"
    commands:
      - "kubectl get events --field-selector reason=Failed"
      - "kubectl get secret <pull-secret> -o yaml"

  CrashLoopBackOff:
    causes:
      - "Application error at startup"
      - "Missing configuration (env vars, configmaps)"
      - "Liveness probe too aggressive"
    commands:
      - "kubectl logs <pod> --previous"
      - "kubectl describe pod <pod> | grep -A 10 Liveness"

  OOMKilled:
    causes:
      - "Memory limit too low"
      - "Memory leak in application"
    commands:
      - "kubectl describe pod <pod> | grep -A 5 Last State"
      - "kubectl top pod <pod>"
DevOps 면접 준비가 되셨나요?
인터랙티브 시뮬레이터, flashcards, 기술 테스트로 연습하세요.
Infrastructure as Code
IaC 질문은 프로비저닝 도구와 모범 사례에 대한 숙련도를 평가합니다.
Q7: Terraform vs Ansible: 각 도구를 언제 사용해야 합니까?
이 두 도구는 서로 다른 철학과 사용 사례를 가지고 있습니다.
# terraform-example.tf
# Terraform: Infrastructure provisioning (declarative)
# Ideal for: cloud resources, networking, infrastructure state

terraform {
  required_providers {
    aws = {
      source  = "hashicorp/aws"
      version = "~> 5.0"
    }
  }
  # Remote state for collaboration
  backend "s3" {
    bucket         = "terraform-state-prod"
    key            = "infrastructure/terraform.tfstate"
    region         = "eu-west-1"
    dynamodb_table = "terraform-locks"
    encrypt        = true
  }
}

# Declarative resource: Terraform manages the lifecycle
resource "aws_eks_cluster" "main" {
  name     = "production-cluster"
  role_arn = aws_iam_role.eks_cluster.arn
  version  = "1.29"

  vpc_config {
    subnet_ids              = module.vpc.private_subnets
    endpoint_private_access = true
    endpoint_public_access  = false
  }

  # Implicit dependencies managed by Terraform
  depends_on = [
    aws_iam_role_policy_attachment.eks_cluster_policy
  ]
}

# Reusable modules for standardization
module "vpc" {
  source  = "terraform-aws-modules/vpc/aws"
  version = "5.0.0"

  name = "production-vpc"
  cidr = "10.0.0.0/16"

  azs             = ["eu-west-1a", "eu-west-1b", "eu-west-1c"]
  private_subnets = ["10.0.1.0/24", "10.0.2.0/24", "10.0.3.0/24"]
  public_subnets  = ["10.0.101.0/24", "10.0.102.0/24", "10.0.103.0/24"]

  enable_nat_gateway = true
  single_nat_gateway = false  # HA: one NAT per AZ
}# ansible-example.yml
# Ansible: Configuration management (procedural/declarative)
# Ideal for: OS configuration, app deployment, orchestration
---
- name: Configure application servers
hosts: app_servers
become: yes
vars:
app_version: "2.5.0"
tasks:
# System package management
- name: Install required packages
ansible.builtin.apt:
name:
- nginx
- python3-pip
- supervisor
state: present
update_cache: yes
# Configuration via Jinja2 templates
- name: Deploy nginx configuration
ansible.builtin.template:
src: templates/nginx.conf.j2
dest: /etc/nginx/sites-available/app
owner: root
group: root
mode: '0644'
notify: Reload nginx
# Application deployment
- name: Deploy application
ansible.builtin.git:
repo: "https://github.com/org/app.git"
dest: /opt/app
version: "v{{ app_version }}"
notify: Restart application
handlers:
- name: Reload nginx
ansible.builtin.service:
name: nginx
state: reloaded
- name: Restart application
ansible.builtin.supervisorctl:
name: app
state: restarted요약하면: Terraform은 인프라(무엇이 존재하는지), Ansible은 설정(어떻게 구성되었는지)을 위해 사용합니다. 두 도구는 완전한 워크플로에서 결합되는 경우가 많습니다.
Q8: 대규모 조직을 위한 Terraform 프로젝트를 어떻게 구조화합니까?
환경 분리가 있는 모듈식 구조는 유지 관리와 협업을 용이하게 합니다.
# terraform-project-structure
# Recommended structure for enterprise projects

terraform-infrastructure/
├── modules/                    # Reusable modules
│   ├── networking/
│   │   ├── main.tf
│   │   ├── variables.tf
│   │   ├── outputs.tf
│   │   └── README.md
│   ├── kubernetes/
│   │   ├── main.tf
│   │   ├── variables.tf
│   │   └── outputs.tf
│   └── database/
│       ├── main.tf
│       ├── variables.tf
│       └── outputs.tf
│
├── environments/               # Per-environment configuration
│   ├── dev/
│   │   ├── main.tf            # Calls modules
│   │   ├── variables.tf
│   │   ├── terraform.tfvars   # Dev values
│   │   └── backend.tf         # Dev state
│   ├── staging/
│   │   ├── main.tf
│   │   ├── terraform.tfvars
│   │   └── backend.tf
│   └── production/
│       ├── main.tf
│       ├── terraform.tfvars
│       └── backend.tf
│
├── shared/                     # Shared resources
│   ├── iam/
│   └── dns/
│
└── .github/
    └── workflows/
└── terraform.yml # CI/CD pipeline# environments/production/main.tf
# Example of module usage
module "networking" {
source = "../../modules/networking"
environment = "production"
vpc_cidr = var.vpc_cidr
azs = var.availability_zones
enable_flow_logs = true
}
module "kubernetes" {
source = "../../modules/kubernetes"
environment = "production"
cluster_name = "prod-cluster"
vpc_id = module.networking.vpc_id
subnet_ids = module.networking.private_subnet_ids
node_groups = var.node_groups
# Production: HA configuration
cluster_version = "1.29"
enable_cluster_autoscaler = true
}
module "database" {
source = "../../modules/database"
environment = "production"
vpc_id = module.networking.vpc_id
subnet_ids = module.networking.database_subnet_ids
instance_class = "db.r6g.xlarge"
multi_az = true # HA in production
backup_retention = 30
}이 구조는 다음을 가능하게 합니다: 모듈 버전 관리, 환경별 변경 검토, 코드 재사용.
모니터링과 관찰 가능성
모니터링 질문은 관찰 가능한 시스템을 설계하는 능력을 평가합니다.
Q9: 관찰 가능성의 세 가지 기둥은 무엇입니까?
관찰 가능성은 시스템의 내부 상태를 이해하는 데 도움이 되는 세 가지 보완적인 데이터 유형에 의존합니다.
# observability-pillars.yaml
# The three pillars of observability

pillars:
  metrics:
    description: "Numeric data aggregated over time"
    characteristics:
      - "Low cardinality"
      - "Efficient storage"
      - "Ideal for alerting"
    examples:
      - "request_count (counter)"
      - "response_time_seconds (histogram)"
      - "active_connections (gauge)"
    tools:
      - "Prometheus"
      - "Datadog"
      - "CloudWatch"
    use_cases:
      - "Real-time dashboards"
      - "Threshold alerts"
      - "Capacity planning"

  logs:
    description: "Timestamped text events"
    characteristics:
      - "High cardinality"
      - "Detailed context"
      - "Large storage"
    examples:
      - "Application errors"
      - "Audit events"
      - "Debug information"
    tools:
      - "Loki"
      - "Elasticsearch"
      - "CloudWatch Logs"
    use_cases:
      - "Debugging"
      - "Audit compliance"
      - "Root cause analysis"

  traces:
    description: "Request tracking across services"
    characteristics:
      - "End-to-end view"
      - "Context propagation"
      - "Bottleneck identification"
    examples:
      - "Distributed transaction"
      - "Service dependencies"
      - "Latency breakdown"
    tools:
      - "Jaeger"
      - "Tempo"
      - "AWS X-Ray"
    use_cases:
      - "Performance optimization"
      - "Service dependencies"
      - "Error propagation"
Q10: 효과적인 알림을 어떻게 구성합니까?
잘 설계된 알림은 피로를 줄이고 빠른 인시던트 대응을 가능하게 합니다.
# prometheus-alerting-rules.yaml
# Prometheus alerting rules with best practices

groups:
  - name: application-alerts
    rules:
      # Alert on symptom, not cause
      - alert: HighErrorRate
        # Error rate > 1% over 5 minutes
        expr: |
          sum(rate(http_requests_total{status=~"5.."}[5m]))
          /
          sum(rate(http_requests_total[5m]))
          > 0.01
        for: 5m  # Avoid false positives
        labels:
          severity: critical
          team: backend
        annotations:
          summary: "High error rate detected"
          description: |
            Error rate is {{ $value | humanizePercentage }}
            for the last 5 minutes.
          runbook_url: "https://wiki.example.com/runbooks/high-error-rate"

      # Proactive alert on saturation
      - alert: DiskSpaceRunningLow
        expr: |
          (node_filesystem_avail_bytes / node_filesystem_size_bytes)
          * 100 < 20
        for: 15m
        labels:
          severity: warning
        annotations:
          summary: "Disk space below 20%"
          description: |
            Node {{ $labels.instance }} has only
            {{ $value | humanize }}% disk space remaining.

      # SLO-based alerting
      - alert: SLOBudgetBurnRate
        # Error budget consumed too quickly
        expr: |
          (
            sum(rate(http_requests_total{status=~"5.."}[1h]))
            /
            sum(rate(http_requests_total[1h]))
          ) > (1 - 0.999) * 14.4
        for: 5m
        labels:
          severity: critical
        annotations:
          summary: "SLO budget burning too fast"
          description: |
            At current error rate, monthly SLO budget will be
exhausted in less than 2 days.# alertmanager-config.yaml
# AlertManager configuration with intelligent routing
global:
resolve_timeout: 5m
route:
receiver: default
group_by: [alertname, cluster, service]
group_wait: 30s # Wait to group alerts
group_interval: 5m # Interval between grouped notifications
repeat_interval: 4h # Re-alert if not resolved
routes:
# Critical alerts: immediate notification
- match:
severity: critical
receiver: pagerduty-critical
continue: true # Also notify Slack
# Alerts by team
- match:
team: backend
receiver: slack-backend
- match:
team: infrastructure
receiver: slack-infra
receivers:
- name: pagerduty-critical
pagerduty_configs:
- service_key: <pagerduty-key>
severity: critical
- name: slack-backend
slack_configs:
- channel: '#alerts-backend'
send_resolved: true
title: '{{ .Status | toUpper }}: {{ .CommonAnnotations.summary }}'
text: '{{ .CommonAnnotations.description }}'핵심 원칙: 원인이 아닌 증상(사용자 영향)에 따라 알림을 보내고, 런북을 포함시키며, SLO에 따라 임계값을 조정합니다.
보안과 컴플라이언스
보안 질문은 위험과 대책에 대한 이해를 평가합니다.
Q11: Kubernetes 클러스터를 어떻게 보안합니까?
Kubernetes 보안은 여러 레이어를 다룹니다: 네트워크, 인증, 워크로드, 데이터.
# kubernetes-security-policies.yaml
# NetworkPolicy: network isolation between namespaces

apiVersion: networking.k8s.io/v1
kind: NetworkPolicy
metadata:
  name: default-deny-all
  namespace: production
spec:
  # Applied to all pods in namespace
  podSelector: {}
  policyTypes:
    - Ingress
    - Egress
  # No traffic allowed by default
  ingress: []
  egress: []
---
# Allow only necessary traffic
apiVersion: networking.k8s.io/v1
kind: NetworkPolicy
metadata:
  name: api-network-policy
  namespace: production
spec:
  podSelector:
    matchLabels:
      app: api
  policyTypes:
    - Ingress
    - Egress
  ingress:
    # Accept only from ingress controller
    - from:
        - namespaceSelector:
            matchLabels:
              name: ingress-nginx
      ports:
        - protocol: TCP
          port: 8080
  egress:
    # Allow to database
    - to:
        - podSelector:
            matchLabels:
              app: postgres
      ports:
        - protocol: TCP
          port: 5432
    # Allow DNS
    - to:
        - namespaceSelector: {}
          podSelector:
            matchLabels:
              k8s-app: kube-dns
      ports:
        - protocol: UDP
port: 53# pod-security-standards.yaml
# PodSecurity: workload restrictions
apiVersion: v1
kind: Namespace
metadata:
name: production
labels:
# Enforce: blocks violations
pod-security.kubernetes.io/enforce: restricted
# Warn: warns without blocking
pod-security.kubernetes.io/warn: restricted
# Audit: logs violations
pod-security.kubernetes.io/audit: restricted
---
# Pod compliant with "restricted" standards
apiVersion: v1
kind: Pod
metadata:
name: secure-pod
namespace: production
spec:
securityContext:
runAsNonRoot: true
runAsUser: 1000
fsGroup: 1000
seccompProfile:
type: RuntimeDefault
containers:
- name: app
image: myapp:latest
securityContext:
allowPrivilegeEscalation: false
readOnlyRootFilesystem: true
capabilities:
drop:
- ALL
resources:
limits:
memory: "256Mi"
cpu: "500m"
requests:
memory: "128Mi"
cpu: "250m"
volumeMounts:
- name: tmp
mountPath: /tmp
volumes:
- name: tmp
emptyDir: {}Kubernetes 보안은 여러 레이어를 결합합니다: 인가를 위한 RBAC, 네트워크 격리를 위한 NetworkPolicies, 워크로드 제한을 위한 PodSecurity, 저장 시 시크릿 암호화.
Q12: 최소 권한 원칙이란 무엇이며 어떻게 적용합니까?
이 원칙은 사용자나 시스템이 작업을 완료하는 데 필요한 최소한의 권한만 가져야 한다고 규정합니다.
# rbac-least-privilege.yaml
# Kubernetes RBAC with minimal permissions

# Role: permissions in a specific namespace
apiVersion: rbac.authorization.k8s.io/v1
kind: Role
metadata:
  namespace: production
  name: deployment-manager
rules:
  # Pod reading (for monitoring)
  - apiGroups: [""]
    resources: ["pods", "pods/log"]
    verbs: ["get", "list", "watch"]
  # Deployment management only
  - apiGroups: ["apps"]
    resources: ["deployments"]
    verbs: ["get", "list", "watch", "update", "patch"]
  # No create/delete on deployments
  # No access to secrets or sensitive configmaps
---
# RoleBinding: Role <-> ServiceAccount association
apiVersion: rbac.authorization.k8s.io/v1
kind: RoleBinding
metadata:
  name: deployment-manager-binding
  namespace: production
subjects:
  - kind: ServiceAccount
    name: ci-cd-deployer
    namespace: production
roleRef:
  kind: Role
  name: deployment-manager
  apiGroup: rbac.authorization.k8s.io
---
# Dedicated ServiceAccount for CI/CD
apiVersion: v1
kind: ServiceAccount
metadata:
  name: ci-cd-deployer
  namespace: production
  annotations:
    # Automatic token expiration
    kubernetes.io/enforce-mountable-secrets: "true"
이 원칙은 AWS IAM, 데이터베이스, 네트워크 접근에도 적용됩니다.
SRE와 신뢰성
SRE 질문은 신뢰성 실천과 인시던트 관리에 대한 이해를 평가합니다.
Q13: SLO란 무엇이며 어떻게 정의합니까?
Service Level Objectives(SLO)는 서비스의 기대 신뢰성을 정량화하고 엔지니어링 결정을 안내합니다.
# slo-definitions.yaml
# SLO definitions for an API service

service: payment-api
owner: payments-team

slos:
  - name: availability
    description: "Service responds successfully to requests"
    sli:
      # SLI: measured metric
      type: availability
      good_events: "http_requests_total{status=~'2..'}"
      total_events: "http_requests_total"
    target: 99.9%  # SLO: objective
    window: 30d    # Measurement window
    # Error budget: 0.1% = 43.2 minutes/month
    error_budget:
      monthly_minutes: 43.2

  - name: latency
    description: "Response time below threshold"
    sli:
      type: latency
      good_events: "http_request_duration_seconds_bucket{le='0.3'}"
      total_events: "http_request_duration_seconds_count"
    target: 99%  # 99% of requests < 300ms
    window: 30d

  - name: throughput
    description: "Ability to process transactions"
    sli:
      type: throughput
      query: "sum(rate(transactions_processed_total[5m]))"
    target: ">= 1000 TPS"

# Actions based on error budget
error_budget_policy:
  - condition: "remaining > 50%"
    actions:
      - "Feature development prioritized"
      - "Experimentation allowed"
  - condition: "remaining 20-50%"
    actions:
      - "Balance features and reliability"
      - "Increase testing coverage"
  - condition: "remaining < 20%"
    actions:
      - "Freeze non-critical deployments"
      - "Focus on reliability improvements"
  - condition: "exhausted"
    actions:
      - "Incident response mode"
      - "All hands on reliability"
SLO는 객관적인 결정을 가능하게 합니다: 새 기능 배포 vs 신뢰성 강화.
Q14: 효과적인 포스트모템을 어떻게 진행합니까?
블레임리스 포스트모템은 학습을 촉진하고 미래 인시던트를 예방합니다.
# postmortem-template.yaml
# Blameless post-mortem template

incident:
  id: "INC-2026-0042"
  title: "Payment service unavailability"
  severity: SEV1
  duration: "45 minutes"
  date: "2026-01-15"

# Factual timeline
timeline:
  - time: "14:32"
    event: "Alert: error rate > 5% on payment-api"
    actor: "PagerDuty"
  - time: "14:35"
    event: "Incident declared, team notified"
    actor: "On-call engineer"
  - time: "14:42"
    event: "Cause identified: connection pool exhausted"
    actor: "Backend team"
  - time: "14:55"
    event: "Mitigation: deployment rollback"
    actor: "Backend team"
  - time: "15:17"
    event: "Service restored, monitoring stable"
    actor: "Backend team"

# Measurable impact
impact:
  users_affected: 12500
  transactions_failed: 847
  revenue_impact: "~$16,500"
  slo_budget_consumed: "2.3 days"

# Root cause analysis (5 Whys)
root_cause_analysis:
  - question: "Why was the service unavailable?"
    answer: "DB connections were exhausted"
  - question: "Why were connections exhausted?"
    answer: "A slow query was blocking connections"
  - question: "Why was there a slow query?"
    answer: "Missing index on a new table"
  - question: "Why was the index missing?"
    answer: "Incomplete migration deployed"
  - question: "Why was the migration incomplete?"
    answer: "No execution plan validation in staging"

# Corrective actions
action_items:
  - id: "AI-001"
    type: "prevent"
    description: "Add SQL execution plan validation in CI"
    owner: "DBA team"
    due_date: "2026-01-22"
    priority: P1

  - id: "AI-002"
    type: "detect"
    description: "Alert on connection pool usage > 80%"
    owner: "SRE team"
    due_date: "2026-01-18"
    priority: P1

  - id: "AI-003"
    type: "mitigate"
    description: "Implement circuit breaker on DB queries"
    owner: "Backend team"
    due_date: "2026-01-29"
    priority: P2

# Lessons learned
lessons_learned:
  what_went_well:
    - "Fast detection thanks to alerting (< 3 min)"
    - "Clear communication in incident channel"
    - "Rollback completed in less than 15 minutes"
  what_went_poorly:
    - "No load testing on new endpoint"
    - "Staging didn't reflect prod data volume"
  lucky:
    - "Incident during daytime with full team available"
목표는 시스템을 개선하는 것이지, 비난할 사람을 찾는 것이 아닙니다. 조치는 세 가지 범주로 분류됩니다: 예방, 감지, 완화.
연습을 시작하세요!
면접 시뮬레이터와 기술 테스트로 지식을 테스트하세요.
결론
DevOps 인터뷰는 문화부터 기술 도구까지 광범위한 기술을 다룹니다. 성공의 열쇠는 구체적인 구현 예시로 설명된 개념에 대한 깊은 이해를 보여주는 데 있습니다.
준비 체크리스트
- ✅ CI/CD 개념을 숙달하고 완전한 파이프라인을 설계할 수 있다
- ✅ Kubernetes 아키텍처를 이해하고 일반적인 문제를 디버그할 수 있다
- ✅ IaC 도구(Terraform, Ansible)와 각각의 사용 사례를 알고 있다
- ✅ 모니터링 설정 및 관련 알림 정의 방법을 알고 있다
- ✅ 보안 모범 사례(최소 권한, 심층 방어)를 적용할 수 있다
- ✅ SRE 실천(SLO, 에러 버짓, 포스트모템)을 설명할 수 있다
- ✅ 구체적인 문제 해결 예시를 가지고 있다
- ✅ 복잡한 개념을 간단하게 설명할 수 있다
태그
공유
관련 기사
ArgoCD와 GitOps 완벽 가이드 2026: Kubernetes 지속적 배포 전략과 면접 핵심 질문
ArgoCD 3.4 GitOps 튜토리얼. Kubernetes 지속적 배포, Application CRD, Sync Waves, 멀티클러스터 관리, Flux 비교, 면접 빈출 질문을 YAML 예제와 함께 해설합니다.

Kubernetes 면접 완벽 가이드: Pod, Service, Deployment 핵심 정리
Kubernetes 면접에서 자주 출제되는 Pod, Service, Deployment의 핵심 개념을 YAML 예제와 함께 상세히 정리합니다. 2026년 최신 트렌드를 반영한 실전 대비 가이드입니다.

Prometheus vs Grafana vs Datadog 2026: 모니터링 아키텍처 비교와 DevOps 면접 핵심 질문
2026년 Prometheus, Grafana, Datadog 모니터링 도구를 아키텍처, 쿼리 언어, 알림 전략, 비용, Kubernetes 통합 관점에서 비교합니다. DevOps 및 SRE 면접 빈출 옵저버빌리티 질문과 답변을 포함합니다.