Spring Boot Actuator: Giám Sát Sản Xuất với Micrometer và Prometheus
Hướng dẫn đầy đủ về Spring Boot Actuator để giám sát môi trường sản xuất. Cấu hình Micrometer, metric Prometheus, endpoint tùy chỉnh và cảnh báo.
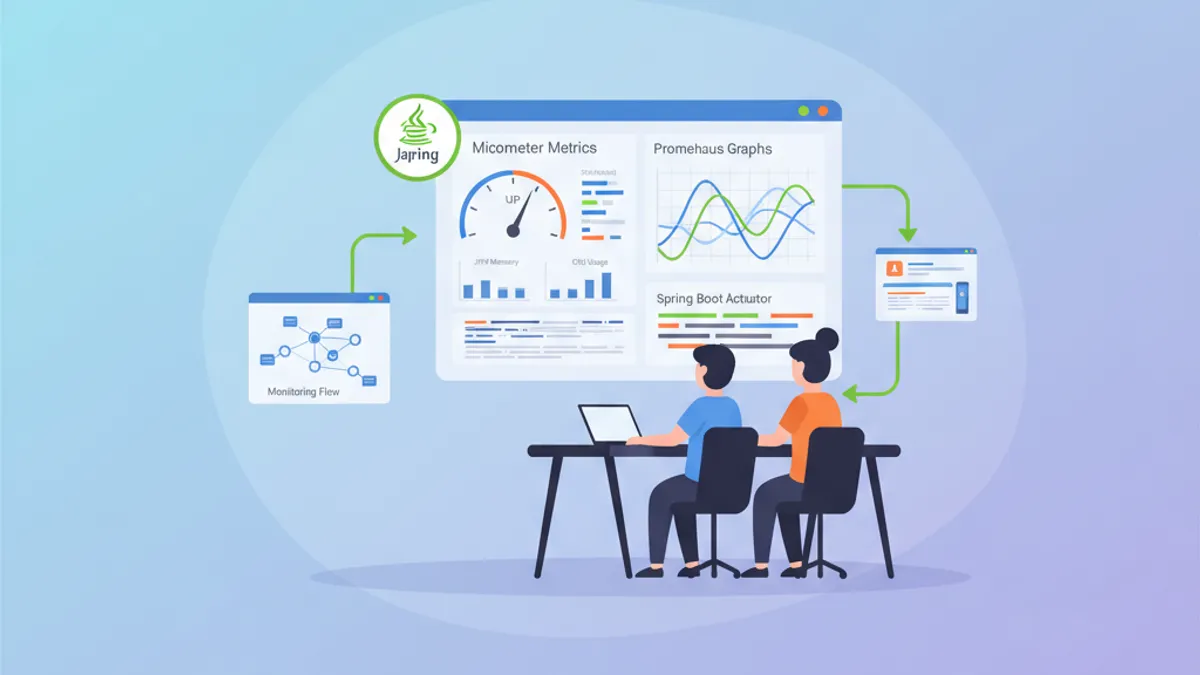
Spring Boot Actuator thay đổi cách giám sát ứng dụng Java khi cung cấp các endpoint sẵn sàng cho sản xuất phục vụ health check, metric và chẩn đoán. Khi kết hợp với Micrometer và Prometheus, bộ công cụ này tạo nên một giải pháp observability hoàn chỉnh cho môi trường sản xuất.
Actuator tự động phơi bày hơn 50 metric của JVM và ứng dụng mà không cần cấu hình bổ sung. Micrometer đóng vai trò mặt tiền (facade) để công bố các metric này tới Prometheus, Grafana, Datadog hay bất kỳ hệ thống giám sát nào khác.
Cấu Hình Cơ Bản với Spring Boot 3
Các Phụ Thuộc Maven Cần Thiết
Việc tích hợp Actuator với Prometheus đòi hỏi ba phụ thuộc chính. Starter Actuator kích hoạt các endpoint, Micrometer cung cấp tầng trừu tượng metric, còn registry Prometheus định dạng dữ liệu để scraping.
<!-- pom.xml -->
<!-- Actuator + Micrometer + Prometheus Configuration -->
<dependencies>
    <!-- Spring Boot Actuator - monitoring endpoints -->
    <dependency>
        <groupId>org.springframework.boot</groupId>
        <artifactId>spring-boot-starter-actuator</artifactId>
    </dependency>

    <!-- Micrometer Registry Prometheus -->
    <!-- Exposes metrics in Prometheus format -->
    <dependency>
        <groupId>io.micrometer</groupId>
        <artifactId>micrometer-registry-prometheus</artifactId>
    </dependency>

    <!-- AOP for @Timed and @Counted metrics -->
    <dependency>
        <groupId>org.springframework.boot</groupId>
        <artifactId>spring-boot-starter-aop</artifactId>
    </dependency>
</dependencies>
Các phụ thuộc này đủ để phơi bày endpoint /actuator/prometheus mà Prometheus có thể truy vấn định kỳ.
Cấu Hình Endpoint Actuator
Mặc định, chỉ endpoint health và info được phơi qua HTTP. Cấu hình tường minh quyết định endpoint nào vẫn truy cập được trong môi trường sản xuất.
# application.yml
# Actuator configuration for production
management:
  endpoints:
    web:
      exposure:
        # Endpoints exposed over HTTP
        # health, info, prometheus are minimum for monitoring
        include: health,info,prometheus,metrics,env,loggers
      base-path: /actuator
    # Disable unused endpoints to reduce attack surface
    enabled-by-default: false
  endpoint:
    # Enable each required endpoint individually
    health:
      enabled: true
      show-details: when-authorized
      show-components: when-authorized
    info:
      enabled: true
    prometheus:
      enabled: true
    metrics:
      enabled: true
    env:
      enabled: true
      # Mask sensitive values
      show-values: when-authorized
    loggers:
      enabled: true
Tùy chọn show-details: when-authorized hiển thị chi tiết health chỉ với người dùng đã xác thực và có vai trò phù hợp.
// Securing Actuator endpoints
package com.example.monitoring.config;

import org.springframework.boot.actuate.autoconfigure.security.servlet.EndpointRequest;
import org.springframework.context.annotation.Bean;
import org.springframework.context.annotation.Configuration;
import org.springframework.security.config.annotation.web.builders.HttpSecurity;
import org.springframework.security.web.SecurityFilterChain;

@Configuration
public class ActuatorSecurityConfig {

    @Bean
    SecurityFilterChain actuatorSecurityFilterChain(HttpSecurity http) throws Exception {
        return http
            .securityMatcher(EndpointRequest.toAnyEndpoint())
            .authorizeHttpRequests(auth -> auth
                // Health and info public for load balancers
                .requestMatchers(EndpointRequest.to("health", "info")).permitAll()
                // Prometheus accessible from internal network
                .requestMatchers(EndpointRequest.to("prometheus")).hasIpAddress("10.0.0.0/8")
                // Other endpoints restricted to admins
                .anyRequest().hasRole("ACTUATOR_ADMIN")
            )
            .httpBasic(basic -> {})
            .build();
    }
}
Cấu hình này mở quyền truy cập công khai cho các endpoint cơ bản trong khi vẫn bảo vệ các endpoint nhạy cảm.
Metric Tùy Chỉnh với Micrometer
Counter và Gauge cho Ứng Dụng
Micrometer cung cấp nhiều loại metric phù hợp với từng tình huống. Counter đo các sự kiện tích lũy, gauge đo giá trị tức thời và timer đo thời lượng của một thao tác.
// Custom business metrics service
package com.example.monitoring.metrics;

import io.micrometer.core.instrument.Counter;
import io.micrometer.core.instrument.Gauge;
import io.micrometer.core.instrument.MeterRegistry;
import io.micrometer.core.instrument.Timer;
import org.springframework.stereotype.Service;

import java.util.concurrent.atomic.AtomicInteger;
import java.util.function.Supplier;

@Service
public class OrderMetricsService {

    // Counter for orders created with status tag
    private final Counter ordersCreatedCounter;
    // Timer to measure processing duration
    private final Timer orderProcessingTimer;
    // Atomic value for pending orders gauge
    private final AtomicInteger pendingOrdersCount = new AtomicInteger(0);

    public OrderMetricsService(MeterRegistry registry) {
        // Counter with tags for filtering in Prometheus
        this.ordersCreatedCounter = Counter.builder("orders.created.total")
            .description("Total number of orders created")
            .tag("application", "order-service")
            .register(registry);

        // Timer with histogram for percentiles
        this.orderProcessingTimer = Timer.builder("orders.processing.duration")
            .description("Order processing duration")
            .publishPercentiles(0.5, 0.95, 0.99)
            .publishPercentileHistogram()
            .register(registry);

        // Gauge linked to atomic value
        // Updates automatically on each scrape
        Gauge.builder("orders.pending.count", pendingOrdersCount, AtomicInteger::get)
            .description("Number of orders pending processing")
            .register(registry);
    }

    public void recordOrderCreated() {
        ordersCreatedCounter.increment();
        pendingOrdersCount.incrementAndGet();
    }

    public void recordOrderProcessed(Runnable processingLogic) {
        // Automatically measures execution duration
        orderProcessingTimer.record(processingLogic);
        pendingOrdersCount.decrementAndGet();
    }

    public <T> T recordOrderProcessedWithResult(Supplier<T> processingLogic) {
        return orderProcessingTimer.record(processingLogic);
    }
}
Việc dùng tag cho phép lọc và tổng hợp metric trong Prometheus thông qua các truy vấn PromQL chính xác.
Annotation @Timed và @Counted
Để tránh viết code lặp, Micrometer cung cấp các annotation AOP tự động đo đạc các phương thức.
// Automatic instrumentation with annotations
package com.example.monitoring.service;

import io.micrometer.core.annotation.Counted;
import io.micrometer.core.annotation.Timed;
import org.springframework.stereotype.Service;

@Service
public class PaymentService {

    // @Timed automatically creates a Timer
    // Measures each call and publishes count, sum, max
    @Timed(
        value = "payment.process.duration",
        description = "Payment processing duration",
        percentiles = {0.5, 0.95, 0.99},
        histogram = true
    )
    public PaymentResult processPayment(PaymentRequest request) {
        // Payment logic
        validatePayment(request);
        return executePayment(request);
    }

    // @Counted increments a counter on each call
    // Useful for discrete events
    @Counted(
        value = "payment.refunds.total",
        description = "Total number of refunds"
    )
    public void refundPayment(String transactionId) {
        // Refund logic
    }

    // Combining both annotations
    @Timed(value = "payment.validation.duration")
    @Counted(value = "payment.validation.total")
    private void validatePayment(PaymentRequest request) {
        // Payment validation
    }
}// Required configuration to enable @Timed
package com.example.monitoring.config;
import io.micrometer.core.aop.CountedAspect;
import io.micrometer.core.aop.TimedAspect;
import io.micrometer.core.instrument.MeterRegistry;
import org.springframework.context.annotation.Bean;
import org.springframework.context.annotation.Configuration;
@Configuration
public class TimedAspectConfig {
// Aspect required for @Timed to work
@Bean
TimedAspect timedAspect(MeterRegistry registry) {
return new TimedAspect(registry);
}
// Aspect for @Counted
@Bean
CountedAspect countedAspect(MeterRegistry registry) {
return new CountedAspect(registry);
}
}Annotation @Timed và @Counted chỉ hoạt động trên bean Spring và các lời gọi bên ngoài. Lời gọi nội bộ trong cùng một class sẽ bỏ qua proxy AOP và không được đo đạc.
Sẵn sàng chinh phục phỏng vấn Spring Boot?
Luyện tập với mô phỏng tương tác, flashcards và bài kiểm tra kỹ thuật.
Endpoint Health Tùy Chỉnh
Health Indicator cho Nghiệp Vụ
Health Indicator kiểm tra trạng thái của các phụ thuộc bên ngoài và các thành phần nghiệp vụ trọng yếu. Spring Boot cung cấp sẵn indicator cho cơ sở dữ liệu, Redis và nhiều dịch vụ phổ biến khác.
// Health indicator for payment gateway
package com.example.monitoring.health;

import org.springframework.boot.actuate.health.Health;
import org.springframework.boot.actuate.health.HealthIndicator;
import org.springframework.stereotype.Component;
import org.springframework.web.client.RestClient;

import java.time.Duration;
import java.time.Instant;

@Component
public class PaymentGatewayHealthIndicator implements HealthIndicator {

    private final RestClient restClient;
    private final String gatewayHealthUrl;

    public PaymentGatewayHealthIndicator(RestClient.Builder restClientBuilder) {
        this.restClient = restClientBuilder.build();
        this.gatewayHealthUrl = "https://api.payment-gateway.com/health";
    }

    @Override
    public Health health() {
        Instant start = Instant.now();

        try {
            // Call gateway health endpoint
            var response = restClient.get()
                .uri(gatewayHealthUrl)
                .retrieve()
                .toBodilessEntity();

            Duration responseTime = Duration.between(start, Instant.now());

            if (response.getStatusCode().is2xxSuccessful()) {
                return Health.up()
                    .withDetail("responseTime", responseTime.toMillis() + "ms")
                    .withDetail("statusCode", response.getStatusCode().value())
                    .build();
            } else {
                return Health.down()
                    .withDetail("statusCode", response.getStatusCode().value())
                    .withDetail("reason", "Unexpected status code")
                    .build();
            }
        } catch (Exception e) {
            Duration responseTime = Duration.between(start, Instant.now());

            return Health.down()
                .withDetail("error", e.getClass().getSimpleName())
                .withDetail("message", e.getMessage())
                .withDetail("responseTime", responseTime.toMillis() + "ms")
                .build();
        }
    }
}
Indicator này tự động xuất hiện trong /actuator/health dưới tên paymentGateway.
Health Group cho Kubernetes
Health group cho phép tạo các endpoint riêng biệt cho probe liveness và readiness của Kubernetes.
# application.yml
# Health groups configuration for Kubernetes
management:
  endpoint:
    health:
      group:
        # Liveness probe - is the application alive?
        liveness:
          include: livenessState
          show-details: always
        # Readiness probe - can the application receive traffic?
        readiness:
          include: readinessState,db,redis,paymentGateway
          show-details: always
        # Custom probe for critical dependencies
        critical:
          include: db,paymentGateway
          show-details: when-authorized
  health:
    # Enable Kubernetes states
    livenessstate:
      enabled: true
    readinessstate:
enabled: true// Programmatic health groups configuration
package com.example.monitoring.config;
import org.springframework.boot.actuate.availability.LivenessStateHealthIndicator;
import org.springframework.boot.actuate.availability.ReadinessStateHealthIndicator;
import org.springframework.boot.availability.ApplicationAvailability;
import org.springframework.context.annotation.Bean;
import org.springframework.context.annotation.Configuration;
@Configuration
public class KubernetesHealthConfig {
@Bean
LivenessStateHealthIndicator livenessStateHealthIndicator(
ApplicationAvailability availability) {
return new LivenessStateHealthIndicator(availability);
}
@Bean
ReadinessStateHealthIndicator readinessStateHealthIndicator(
ApplicationAvailability availability) {
return new ReadinessStateHealthIndicator(availability);
}
}Probe Kubernetes sau đó trỏ tới các endpoint chuyên biệt:
# kubernetes-deployment.yml
# Kubernetes probes configuration
spec:
  containers:
    - name: order-service
      livenessProbe:
        httpGet:
          path: /actuator/health/liveness
          port: 8080
        initialDelaySeconds: 30
        periodSeconds: 10
        failureThreshold: 3
      readinessProbe:
        httpGet:
          path: /actuator/health/readiness
          port: 8080
        initialDelaySeconds: 10
        periodSeconds: 5
        failureThreshold: 3
Tích Hợp Prometheus và Grafana
Cấu Hình Scraping của Prometheus
Prometheus thu thập metric bằng cách truy vấn endpoint /actuator/prometheus định kỳ. Cấu hình xác định các mục tiêu cần scrape.
# prometheus.yml
# Prometheus configuration for Spring Boot
global:
  scrape_interval: 15s
  evaluation_interval: 15s

scrape_configs:
  - job_name: 'spring-boot-apps'
    metrics_path: '/actuator/prometheus'
    scrape_interval: 10s
    static_configs:
      - targets:
          - 'order-service:8080'
          - 'payment-service:8080'
          - 'inventory-service:8080'
    # Relabeling to add metadata
    relabel_configs:
      - source_labels: [__address__]
        target_label: instance
        regex: '([^:]+):\d+'
        replacement: '${1}'

  # Kubernetes service discovery
  - job_name: 'kubernetes-pods'
    kubernetes_sd_configs:
      - role: pod
    relabel_configs:
      # Only scrape pods with annotation
      - source_labels: [__meta_kubernetes_pod_annotation_prometheus_io_scrape]
        action: keep
        regex: true
      - source_labels: [__meta_kubernetes_pod_annotation_prometheus_io_path]
        action: replace
        target_label: __metrics_path__
        regex: (.+)
Metric JVM Mặc Định
Actuator kết hợp Micrometer tự động phơi bày các metric JVM chi tiết. Những metric quan trọng nhất cho việc giám sát được liệt kê dưới đây.
# PromQL queries for JVM monitoring

# Heap memory usage
jvm_memory_used_bytes{area="heap"}

# Memory usage percentage
jvm_memory_used_bytes{area="heap"} / jvm_memory_max_bytes{area="heap"} * 100

# Active threads
jvm_threads_live_threads

# Garbage collection - time spent
rate(jvm_gc_pause_seconds_sum[5m])

# GC count per minute
rate(jvm_gc_pause_seconds_count[1m]) * 60

# CPU used by JVM
process_cpu_usage

# Active database connections
hikaricp_connections_active

# Connection pool utilization
hikaricp_connections_active / hikaricp_connections_max * 100// Additional JVM metrics
package com.example.monitoring.metrics;
import io.micrometer.core.instrument.Gauge;
import io.micrometer.core.instrument.MeterRegistry;
import io.micrometer.core.instrument.binder.MeterBinder;
import org.springframework.stereotype.Component;
import java.lang.management.ManagementFactory;
import java.lang.management.OperatingSystemMXBean;
@Component
public class CustomJvmMetrics implements MeterBinder {
@Override
public void bindTo(MeterRegistry registry) {
OperatingSystemMXBean osBean = ManagementFactory.getOperatingSystemMXBean();
// System load average
Gauge.builder("system.load.average", osBean, OperatingSystemMXBean::getSystemLoadAverage)
.description("System load average over 1 minute")
.register(registry);
// Available processors count
Gauge.builder("system.cpu.count", osBean, OperatingSystemMXBean::getAvailableProcessors)
.description("Number of available processors")
.register(registry);
// Application uptime
Gauge.builder("application.uptime.seconds",
ManagementFactory.getRuntimeMXBean(),
bean -> bean.getUptime() / 1000.0)
.description("Application uptime in seconds")
.register(registry);
}
}Dashboard Grafana Sẵn Có
Grafana cung cấp các dashboard được cấu hình sẵn cho Spring Boot. Dashboard ID 12900 mang lại cái nhìn toàn diện về metric Actuator.
{
  "annotations": {
    "list": []
  },
  "panels": [
    {
      "title": "Request Rate",
      "type": "graph",
      "targets": [
        {
          "expr": "rate(http_server_requests_seconds_count{application=\"$application\"}[5m])",
          "legendFormat": "{{method}} {{uri}} - {{status}}"
        }
      ]
    },
    {
      "title": "Response Time P99",
      "type": "graph",
      "targets": [
        {
          "expr": "histogram_quantile(0.99, rate(http_server_requests_seconds_bucket{application=\"$application\"}[5m]))",
          "legendFormat": "{{method}} {{uri}}"
        }
      ]
    },
    {
      "title": "Error Rate",
      "type": "singlestat",
      "targets": [
        {
          "expr": "sum(rate(http_server_requests_seconds_count{application=\"$application\",status=~\"5..\"}[5m])) / sum(rate(http_server_requests_seconds_count{application=\"$application\"}[5m])) * 100"
        }
      ]
    }
  ]
}Để nhập một dashboard: Grafana → Dashboards → Import → ID 12900 (Spring Boot Statistics) hoặc 4701 (JVM Micrometer). Các dashboard này hoạt động trực tiếp với metric chuẩn của Actuator.
Cảnh Báo với Prometheus
Quy Tắc Cảnh Báo Cốt Lõi
Quy tắc cảnh báo của Prometheus kích hoạt thông báo khi metric vượt qua các ngưỡng tới hạn.
# alerting-rules.yml
# Alert rules for Spring Boot applications
groups:
  - name: spring-boot-alerts
    rules:
      # Alert if application is down
      - alert: ApplicationDown
        expr: up{job="spring-boot-apps"} == 0
        for: 1m
        labels:
          severity: critical
        annotations:
          summary: "Application {{ $labels.instance }} is down"
          description: "{{ $labels.instance }} has been down for more than 1 minute"

      # Alert on HTTP error rate
      - alert: HighErrorRate
        expr: |
          sum(rate(http_server_requests_seconds_count{status=~"5.."}[5m])) by (application)
          /
          sum(rate(http_server_requests_seconds_count[5m])) by (application)
          > 0.05
        for: 5m
        labels:
          severity: warning
        annotations:
          summary: "High error rate on {{ $labels.application }}"
          description: "Error rate is {{ $value | humanizePercentage }}"

      # Alert on P99 latency
      - alert: HighLatency
        expr: |
          histogram_quantile(0.99,
            rate(http_server_requests_seconds_bucket[5m])
          ) > 2
        for: 5m
        labels:
          severity: warning
        annotations:
          summary: "High latency detected"
          description: "P99 latency is {{ $value | humanizeDuration }}"

      # Heap memory alert
      - alert: HighHeapUsage
        expr: |
          jvm_memory_used_bytes{area="heap"}
          / jvm_memory_max_bytes{area="heap"}
          > 0.85
        for: 5m
        labels:
          severity: warning
        annotations:
          summary: "High heap memory usage on {{ $labels.instance }}"
          description: "Heap usage is at {{ $value | humanizePercentage }}"

      # Database connection pool exhausted alert
      - alert: DatabaseConnectionPoolExhausted
        expr: |
          hikaricp_connections_active
          / hikaricp_connections_max
          > 0.9
        for: 2m
        labels:
          severity: critical
        annotations:
          summary: "Database connection pool nearly exhausted"
          description: "{{ $value | humanizePercentage }} of connections in use"

      # Excessive GC alert
      - alert: HighGCPause
        expr: |
          rate(jvm_gc_pause_seconds_sum[5m])
          / rate(jvm_gc_pause_seconds_count[5m])
          > 0.5
        for: 5m
        labels:
          severity: warning
        annotations:
          summary: "High GC pause time"
          description: "Average GC pause is {{ $value | humanizeDuration }}"
Các cảnh báo trên bao quát những vấn đề sản xuất phổ biến nhất: tính sẵn sàng, hiệu năng và tài nguyên.
Metric HTTP và Cơ Sở Dữ Liệu
Đo Đạc Tự Động Yêu Cầu HTTP
Spring Boot 3 tự động đo đạc toàn bộ yêu cầu HTTP đầu vào với các metric chi tiết.
# application.yml
# HTTP metrics configuration
management:
  metrics:
    distribution:
      # Enable histograms for percentiles
      percentiles-histogram:
        http.server.requests: true
      percentiles:
        http.server.requests: 0.5, 0.75, 0.95, 0.99
      # Define SLA buckets
      slo:
        http.server.requests: 100ms, 500ms, 1s, 2s
    tags:
      # Global tags added to all metrics
      application: ${spring.application.name}
environment: ${spring.profiles.active:default}// HTTP tags customization
package com.example.monitoring.config;
import io.micrometer.core.instrument.Tag;
import org.springframework.boot.actuate.metrics.web.servlet.WebMvcTagsContributor;
import org.springframework.context.annotation.Bean;
import org.springframework.context.annotation.Configuration;
import org.springframework.web.servlet.HandlerMapping;
import jakarta.servlet.http.HttpServletRequest;
import jakarta.servlet.http.HttpServletResponse;
import java.util.Collections;
@Configuration
public class WebMvcMetricsConfig {
@Bean
WebMvcTagsContributor customTagsContributor() {
return (request, response, handler, exception) -> {
// Add custom tags to HTTP metrics
String userId = request.getHeader("X-User-Id");
String tenantId = request.getHeader("X-Tenant-Id");
return java.util.List.of(
Tag.of("user.type", userId != null ? "authenticated" : "anonymous"),
Tag.of("tenant", tenantId != null ? tenantId : "default")
);
};
}
}Metric HikariCP và Truy Vấn SQL
Metric của connection pool HikariCP được phơi bày tự động. Đối với truy vấn SQL, cấu hình bổ sung kích hoạt việc tracing thời lượng truy vấn.
# application.yml
# HikariCP configuration with metrics
spring:
  datasource:
    hikari:
      pool-name: OrderServicePool
      maximum-pool-size: 20
      minimum-idle: 5
      connection-timeout: 30000
      idle-timeout: 600000
      max-lifetime: 1800000
      # Enable detailed metrics
register-mbeans: true// Additional metrics for SQL queries
package com.example.monitoring.config;
import io.micrometer.core.instrument.MeterRegistry;
import net.ttddyy.dsproxy.listener.logging.SLF4JLogLevel;
import net.ttddyy.dsproxy.support.ProxyDataSourceBuilder;
import org.springframework.beans.factory.annotation.Qualifier;
import org.springframework.boot.autoconfigure.jdbc.DataSourceProperties;
import org.springframework.context.annotation.Bean;
import org.springframework.context.annotation.Configuration;
import org.springframework.context.annotation.Primary;
import javax.sql.DataSource;
@Configuration
public class DataSourceMetricsConfig {
@Bean
@Primary
DataSource metricsDataSource(
DataSourceProperties properties,
MeterRegistry registry) {
// Original DataSource
DataSource originalDataSource = properties
.initializeDataSourceBuilder()
.build();
// Proxy with metrics
return ProxyDataSourceBuilder.create(originalDataSource)
.name("order-service-db")
.listener(new MicrometerQueryMetricsListener(registry))
.logQueryBySlf4j(SLF4JLogLevel.DEBUG)
.build();
}
}// Listener for SQL query metrics
package com.example.monitoring.metrics;
import io.micrometer.core.instrument.MeterRegistry;
import io.micrometer.core.instrument.Timer;
import net.ttddyy.dsproxy.ExecutionInfo;
import net.ttddyy.dsproxy.QueryInfo;
import net.ttddyy.dsproxy.listener.QueryExecutionListener;
import java.util.List;
import java.util.concurrent.TimeUnit;
public class MicrometerQueryMetricsListener implements QueryExecutionListener {
private final Timer queryTimer;
public MicrometerQueryMetricsListener(MeterRegistry registry) {
this.queryTimer = Timer.builder("sql.query.duration")
.description("SQL query execution duration")
.publishPercentiles(0.5, 0.95, 0.99)
.register(registry);
}
@Override
public void beforeQuery(ExecutionInfo execInfo, List<QueryInfo> queryInfoList) {
// Before execution
}
@Override
public void afterQuery(ExecutionInfo execInfo, List<QueryInfo> queryInfoList) {
// Record duration for each query
long elapsedTime = execInfo.getElapsedTime();
queryTimer.record(elapsedTime, TimeUnit.MILLISECONDS);
}
}Thực Hành Tốt Nhất cho Sản Xuất
Cardinality của Metric
Cardinality quá cao làm giảm hiệu năng của Prometheus. Mỗi tổ hợp tag duy nhất tạo ra một chuỗi thời gian riêng biệt.
// ❌ AVOID - Explosive cardinality
package com.example.monitoring.antipattern;

@Service
public class AntiPatternHighCardinality {

    private final MeterRegistry registry;

    // ❌ BAD: userId creates one series per user
    public void trackUserAction(String userId, String action) {
        Counter.builder("user.actions")
            .tag("userId", userId)  // Millions of possible values!
            .tag("action", action)
            .register(registry)
            .increment();
    }
}// ✅ Controlled cardinality
package com.example.monitoring.bestpractice;
@Service
public class GoodPracticeCardinality {
private final MeterRegistry registry;
// ✅ GOOD: User category instead of ID
public void trackUserAction(User user, String action) {
Counter.builder("user.actions")
.tag("userType", user.getSubscriptionType()) // FREE, PREMIUM, ENTERPRISE
.tag("action", action)
.register(registry)
.increment();
}
// ✅ GOOD: Grouping by range
public void trackResponseTime(long responseTimeMs) {
String bucket = categorizeResponseTime(responseTimeMs);
Counter.builder("response.time.bucket")
.tag("bucket", bucket) // fast, normal, slow, very_slow
.register(registry)
.increment();
}
private String categorizeResponseTime(long ms) {
if (ms < 100) return "fast";
if (ms < 500) return "normal";
if (ms < 2000) return "slow";
return "very_slow";
}
}Cấu Hình Sẵn Sàng cho Sản Xuất
# application-production.yml
# Optimized configuration for production
management:
  endpoints:
    web:
      exposure:
        include: health,info,prometheus
  endpoint:
    health:
      show-details: when-authorized
      probes:
        enabled: true
  metrics:
    export:
      prometheus:
        enabled: true
        step: 30s
    distribution:
      percentiles-histogram:
        http.server.requests: true
      minimum-expected-value:
        http.server.requests: 1ms
      maximum-expected-value:
        http.server.requests: 30s
    tags:
      application: ${spring.application.name}
      environment: production
      version: ${app.version:unknown}
  server:
    # Separate port for management endpoints
    port: 9090

# Disable non-essential endpoints in production
  endpoint:
    env:
      enabled: false
    beans:
      enabled: false
    configprops:
      enabled: false
    mappings:
      enabled: false
Kết Luận
Spring Boot Actuator kết hợp với Micrometer và Prometheus mang lại một giải pháp giám sát toàn diện:
✅ Cấu hình tối thiểu — endpoint sẵn sàng cho sản xuất với Spring Boot Starter
✅ Metric JVM tự động — bộ nhớ, thread, GC, CPU mà không cần thêm code
✅ Metric tùy chỉnh — Counter, Gauge, Timer với annotation @Timed/@Counted
✅ Health Indicator — kiểm tra phụ thuộc bên ngoài và trạng thái Kubernetes
✅ Tích hợp Prometheus — định dạng chuẩn cho scraping và cảnh báo
✅ Bảo mật tích hợp — kiểm soát truy cập tới các endpoint nhạy cảm
✅ Dashboard Grafana — hiển thị tức thì với các dashboard cấu hình sẵn
✅ Cảnh báo — quy tắc PromQL phát hiện bất thường trong sản xuất
Ngăn xếp observability này tạo nên nền tảng thiết yếu để vận hành các ứng dụng Spring Boot trong sản xuất một cách tự tin.
Bắt đầu luyện tập!
Kiểm tra kiến thức với mô phỏng phỏng vấn và bài kiểm tra kỹ thuật.
Thẻ
Chia sẻ
Bài viết liên quan

Logging Spring Boot năm 2026: log có cấu trúc trên production với Logback và JSON
Hướng dẫn đầy đủ về logging có cấu trúc trong Spring Boot. Cấu hình Logback JSON, MDC cho tracing, các best practice production và tích hợp ELK Stack.

Spring Kafka: kiến trúc event-driven với consumer chịu lỗi
Hướng dẫn đầy đủ về Spring Kafka cho kiến trúc event-driven. Cấu hình, consumer chịu lỗi, chính sách retry, dead letter queue và các mẫu sản xuất cho ứng dụng phân tán.
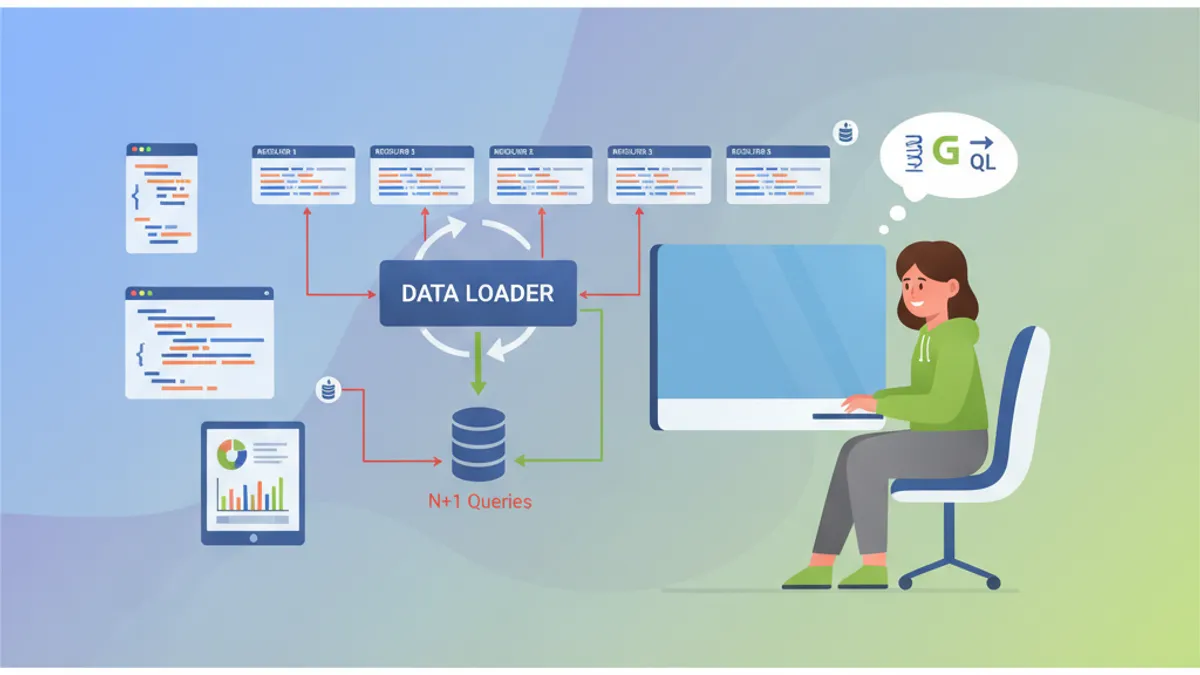
Phỏng vấn Spring GraphQL: Resolver, DataLoader và Giải pháp cho Vấn đề N+1
Chuẩn bị cho phỏng vấn Spring GraphQL với hướng dẫn đầy đủ này. Resolver, DataLoader, xử lý vấn đề N+1, mutation và các thực hành tốt nhất cho câu hỏi kỹ thuật.