Câu hỏi Phỏng vấn DevOps Thiết yếu: Hướng dẫn Đầy đủ 2026
Chuẩn bị phỏng vấn DevOps với những câu hỏi bắt buộc về CI/CD, Kubernetes, Docker, Terraform và các thực tiễn SRE. Có câu trả lời chi tiết.
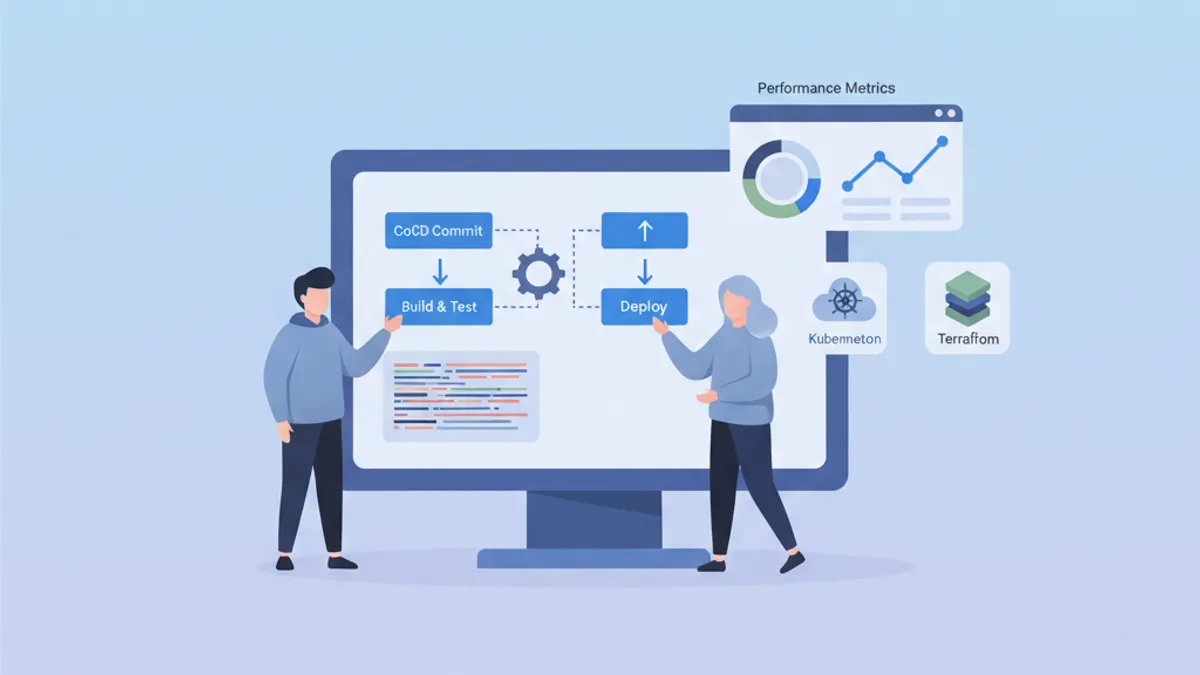
Phỏng vấn DevOps đánh giá sự kết hợp độc đáo giữa kỹ năng phát triển, vận hành và văn hóa tự động hóa. Hướng dẫn này tổng hợp những câu hỏi được hỏi nhiều nhất, được tổ chức theo từng lĩnh vực, kèm câu trả lời có cấu trúc rõ ràng giúp thể hiện sự nắm vững sâu sắc về các khái niệm.
Ngoài kiến thức kỹ thuật, nhà tuyển dụng đánh giá khả năng giải thích các khái niệm phức tạp một cách đơn giản và chia sẻ kinh nghiệm giải quyết vấn đề thực tế.
Nền tảng và Văn hóa DevOps
Các câu hỏi ban đầu thường đánh giá hiểu biết tổng thể về triết lý DevOps.
Q1: DevOps là gì và phương pháp này giải quyết những vấn đề gì?
DevOps là một nền văn hóa và tập hợp thực tiễn thống nhất phát triển phần mềm (Dev) và vận hành IT (Ops). Phương pháp này nhằm rút ngắn chu kỳ phát triển trong khi vẫn duy trì chất lượng cao.
# devops-principles.yaml
# The pillars of DevOps culture
principles:
  collaboration:
    description: "Breaking silos between teams"
    practices:
      - "Shared responsibility for production code"
      - "Continuous communication via ChatOps"
      - "Blameless post-mortems"

  automation:
    description: "Automate repetitive tasks"
    practices:
      - "Infrastructure as Code (IaC)"
      - "CI/CD pipelines"
      - "Automated testing at all levels"

  measurement:
    description: "Measure to improve"
    metrics:
      - "Deployment frequency"
      - "Lead time for changes"
      - "Mean time to recovery (MTTR)"
      - "Change failure rate"

  sharing:
    description: "Share knowledge"
    practices:
      - "Documentation as Code"
      - "Automated runbooks"
      - "Regular knowledge sharing sessions"
Các vấn đề được giải quyết bao gồm: triển khai chậm và rủi ro cao, thiếu tầm nhìn giữa các nhóm, và sự không nhất quán giữa các môi trường.
Q2: Sự khác biệt giữa CI, CD (Continuous Delivery) và CD (Continuous Deployment) là gì?
Ba khái niệm này tạo thành một tiến trình trong tự động hóa chu kỳ phân phối.
# ci-cd-pipeline-stages.sh
# Illustration of CI/CD stages

# ============================================
# CI (Continuous Integration)
# ============================================
# Goal: Frequently integrate code into a shared repository
# Automation: Build + Tests
echo "CI: Code commit → Build → Unit Tests → Integration Tests"

# ============================================
# CD (Continuous Delivery)
# ============================================
# Goal: Code always deployable to production
# Automation: CI + Staging deployment + Manual approval
echo "CD Delivery: CI → Deploy Staging → Manual Approval → Deploy Prod"

# ============================================
# CD (Continuous Deployment)
# ============================================
# Goal: Automatic deployment to production
# Automation: Entire pipeline without human intervention
echo "CD Deployment: CI → Deploy Staging → Auto Tests → Auto Deploy Prod"
Sự khác biệt chính nằm ở mức độ tự động hóa: Continuous Delivery yêu cầu phê duyệt thủ công trước khi đưa vào production, trong khi Continuous Deployment tự động hóa toàn bộ quy trình.
CI/CD và Pipeline
Các câu hỏi CI/CD kiểm tra khả năng thiết kế và tối ưu hóa delivery pipeline.
Q3: Làm thế nào để xây dựng CI/CD pipeline vững chắc?
Một pipeline được thiết kế tốt tuân theo các giai đoạn tuần tự với điểm kiểm tra ở mỗi cấp độ.
# .gitlab-ci.yml
# Complete CI/CD pipeline with parallel and sequential stages
stages:
  - validate
  - build
  - test
  - security
  - deploy-staging
  - integration-tests
  - deploy-production

variables:
  DOCKER_IMAGE: $CI_REGISTRY_IMAGE:$CI_COMMIT_SHA

# ============================================
# Stage 1: Fast validation (< 2 min)
# ============================================
lint:
  stage: validate
  script:
    - npm run lint
    - npm run type-check
  # Run on every commit
  rules:
    - if: $CI_PIPELINE_SOURCE == "merge_request_event"
    - if: $CI_COMMIT_BRANCH

# ============================================
# Stage 2: Application build
# ============================================
build:
  stage: build
  script:
    - docker build -t $DOCKER_IMAGE .
    - docker push $DOCKER_IMAGE
  # Cache Docker layers to speed up builds
  cache:
    key: docker-$CI_COMMIT_REF_SLUG
    paths:
      - .docker-cache/

# ============================================
# Stage 3: Parallel tests
# ============================================
unit-tests:
  stage: test
  script:
    - npm run test:unit -- --coverage
  coverage: '/Lines\s*:\s*(\d+\.?\d*)%/'
  artifacts:
    reports:
      coverage_report:
        coverage_format: cobertura
        path: coverage/cobertura-coverage.xml

integration-tests:
  stage: test
  services:
    - postgres:16-alpine
    - redis:7-alpine
  script:
    - npm run test:integration
  # Parallelization with unit tests
  parallel: 3

# ============================================
# Stage 4: Security analysis
# ============================================
sast:
  stage: security
  script:
    - trivy image --exit-code 1 --severity HIGH,CRITICAL $DOCKER_IMAGE
  allow_failure: false

dependency-scan:
  stage: security
  script:
    - npm audit --audit-level=high
  allow_failure: true  # Alert without blocking

# ============================================
# Stage 5: Staging deployment
# ============================================
deploy-staging:
  stage: deploy-staging
  script:
    - kubectl set image deployment/app app=$DOCKER_IMAGE -n staging
    - kubectl rollout status deployment/app -n staging --timeout=300s
  environment:
    name: staging
    url: https://staging.example.com
  only:
    - develop

# ============================================
# Stage 6: E2E tests on staging
# ============================================
e2e-tests:
  stage: integration-tests
  script:
    - npm run test:e2e -- --base-url=https://staging.example.com
  artifacts:
    when: on_failure
    paths:
      - cypress/screenshots/
      - cypress/videos/
  only:
    - develop

# ============================================
# Stage 7: Production deployment
# ============================================
deploy-production:
  stage: deploy-production
  script:
    - kubectl set image deployment/app app=$DOCKER_IMAGE -n production
    - kubectl rollout status deployment/app -n production --timeout=300s
  environment:
    name: production
    url: https://app.example.com
  # Manual deployment with protection
  when: manual
  only:
    - main
Pipeline này minh họa các thực tiễn tốt nhất: các giai đoạn song song để tăng tốc độ, artifact để truy xuất nguồn gốc, và môi trường được bảo vệ cho production.
Q4: Làm thế nào để quản lý secret trong CI/CD pipeline?
Quản lý secret yêu cầu cách tiếp cận đa tầng kết hợp mã hóa, xoay vòng và nguyên tắc đặc quyền tối thiểu.
# kubernetes-secrets-management.yaml
# Approach 1: External Secrets Operator with HashiCorp Vault
apiVersion: external-secrets.io/v1beta1
kind: ExternalSecret
metadata:
  name: app-secrets
  namespace: production
spec:
  refreshInterval: 1h  # Automatic rotation
  secretStoreRef:
    name: vault-backend
    kind: ClusterSecretStore
  target:
    name: app-secrets
    creationPolicy: Owner
  data:
    # Reference to secret in Vault
    - secretKey: DATABASE_PASSWORD
      remoteRef:
        key: secret/data/production/database
        property: password
    - secretKey: API_KEY
      remoteRef:
        key: secret/data/production/api
        property: key
---
# SecretStore configuration
apiVersion: external-secrets.io/v1beta1
kind: ClusterSecretStore
metadata:
  name: vault-backend
spec:
  provider:
    vault:
      server: "https://vault.example.com"
      path: "secret"
      version: "v2"
      auth:
        kubernetes:
          mountPath: "kubernetes"
          role: "external-secrets"
          # Dedicated ServiceAccount with minimal permissions
          serviceAccountRef:
            name: external-secrets-sa
Các thực tiễn được khuyến nghị: không bao giờ lưu trữ secret dưới dạng plain text trong mã nguồn, sử dụng secret manager chuyên dụng (Vault, AWS Secrets Manager), và bật xoay vòng tự động.
Tránh các biến môi trường CI/CD hiển thị trong log. Luôn che giấu secret bằng các tính năng gốc của nền tảng CI (masked variables).
Kubernetes và Điều phối
Các câu hỏi Kubernetes đánh giá hiểu biết về khái niệm điều phối và khả năng giải quyết vấn đề thực tế.
Q5: Giải thích kiến trúc Kubernetes và vai trò của từng thành phần.
Kubernetes tuân theo kiến trúc master-node với các thành phần có trách nhiệm riêng biệt.
# kubernetes-architecture.yaml
# Control Plane components (Master)
control_plane:
  api_server:
    role: "Entry point for all API requests"
    responsibilities:
      - "Validation and configuration of API objects"
      - "Authentication and authorization"
      - "REST interface for kubectl and other clients"

  etcd:
    role: "Distributed key-value database"
    responsibilities:
      - "Cluster state storage"
      - "Source of truth for configuration"
      - "Consensus via Raft algorithm"

  scheduler:
    role: "Assigning Pods to nodes"
    responsibilities:
      - "Evaluating constraints (resources, affinity)"
      - "Selecting the optimal node"
      - "Respecting PodDisruptionBudgets"

  controller_manager:
    role: "Control loops for desired state"
    controllers:
      - "ReplicaSet Controller"
      - "Deployment Controller"
      - "Service Controller"
      - "Node Controller"

# Worker Node components
worker_nodes:
  kubelet:
    role: "Agent on each node"
    responsibilities:
      - "Communication with Control Plane"
      - "Pod lifecycle management"
      - "Node status reporting"

  kube_proxy:
    role: "Network proxy on each node"
    responsibilities:
      - "iptables/IPVS rules for Services"
      - "Intra-cluster load balancing"

  container_runtime:
    role: "Container execution"
    options:
      - "containerd (recommended)"
      - "CRI-O"
Kiến trúc này cho phép high availability: Control Plane có thể được nhân bản, và workload được phân tán trên các Worker Node.
Q6: Làm thế nào để debug một Pod không chịu khởi động?
Debugging trên Kubernetes theo phương pháp hệ thống bằng cách phân tích từng lớp khác nhau.
# kubernetes-debugging.sh
# Workflow for debugging a failing Pod

# Step 1: Check Pod status
kubectl get pod my-app-pod -o wide
# STATUS: CrashLoopBackOff, ImagePullBackOff, Pending, etc.

# Step 2: Pod details and events
kubectl describe pod my-app-pod
# Important sections:
# - Conditions (PodScheduled, Initialized, Ready)
# - Events (scheduling, pull errors, etc.)

# Step 3: Container logs
kubectl logs my-app-pod --previous  # Previous crash logs
kubectl logs my-app-pod -c init-container  # Init container logs

# Step 4: Interactive execution for debugging
kubectl exec -it my-app-pod -- sh
# Check: env vars, mounted files, network

# Step 5: Check available resources
kubectl describe node <node-name>
# Sections: Allocatable, Allocated resources

# Step 6: Debug with ephemeral Pod (K8s 1.25+)
kubectl debug my-app-pod -it --image=busybox --share-processes
Các nguyên nhân thường gặp bao gồm: tài nguyên không đủ, không tìm thấy image, thiếu secret, hoặc probe được cấu hình sai.
# pod-debugging-checklist.yaml
# Debugging checklist by status
debugging_by_status:
  Pending:
    causes:
      - "Insufficient resources on nodes"
      - "PersistentVolumeClaim not bound"
      - "Affinity/Taints not satisfied"
    commands:
      - "kubectl describe pod <name> | grep -A 20 Events"
      - "kubectl get pvc"
      - "kubectl describe nodes | grep -A 5 Allocated"

  ImagePullBackOff:
    causes:
      - "Non-existent image or incorrect tag"
      - "Private registry without imagePullSecrets"
      - "Docker Hub rate limiting"
    commands:
      - "kubectl get events --field-selector reason=Failed"
      - "kubectl get secret <pull-secret> -o yaml"

  CrashLoopBackOff:
    causes:
      - "Application error at startup"
      - "Missing configuration (env vars, configmaps)"
      - "Liveness probe too aggressive"
    commands:
      - "kubectl logs <pod> --previous"
      - "kubectl describe pod <pod> | grep -A 10 Liveness"

  OOMKilled:
    causes:
      - "Memory limit too low"
      - "Memory leak in application"
    commands:
      - "kubectl describe pod <pod> | grep -A 5 Last State"
      - "kubectl top pod <pod>"
Sẵn sàng chinh phục phỏng vấn DevOps?
Luyện tập với mô phỏng tương tác, flashcards và bài kiểm tra kỹ thuật.
Cơ sở hạ tầng dưới dạng Mã
Các câu hỏi IaC đánh giá khả năng làm chủ công cụ provisioning và các thực tiễn tốt nhất.
Q7: Terraform vs Ansible: khi nào dùng từng công cụ?
Hai công cụ này có triết lý và trường hợp sử dụng khác nhau.
# terraform-example.tf
# Terraform: Infrastructure provisioning (declarative)
# Ideal for: cloud resources, networking, infrastructure state

terraform {
  required_providers {
    aws = {
      source  = "hashicorp/aws"
      version = "~> 5.0"
    }
  }
  # Remote state for collaboration
  backend "s3" {
    bucket         = "terraform-state-prod"
    key            = "infrastructure/terraform.tfstate"
    region         = "eu-west-1"
    dynamodb_table = "terraform-locks"
    encrypt        = true
  }
}

# Declarative resource: Terraform manages the lifecycle
resource "aws_eks_cluster" "main" {
  name     = "production-cluster"
  role_arn = aws_iam_role.eks_cluster.arn
  version  = "1.29"

  vpc_config {
    subnet_ids              = module.vpc.private_subnets
    endpoint_private_access = true
    endpoint_public_access  = false
  }

  # Implicit dependencies managed by Terraform
  depends_on = [
    aws_iam_role_policy_attachment.eks_cluster_policy
  ]
}

# Reusable modules for standardization
module "vpc" {
  source  = "terraform-aws-modules/vpc/aws"
  version = "5.0.0"

  name = "production-vpc"
  cidr = "10.0.0.0/16"

  azs             = ["eu-west-1a", "eu-west-1b", "eu-west-1c"]
  private_subnets = ["10.0.1.0/24", "10.0.2.0/24", "10.0.3.0/24"]
  public_subnets  = ["10.0.101.0/24", "10.0.102.0/24", "10.0.103.0/24"]

  enable_nat_gateway = true
  single_nat_gateway = false  # HA: one NAT per AZ
}# ansible-example.yml
# Ansible: Configuration management (procedural/declarative)
# Ideal for: OS configuration, app deployment, orchestration
---
- name: Configure application servers
hosts: app_servers
become: yes
vars:
app_version: "2.5.0"
tasks:
# System package management
- name: Install required packages
ansible.builtin.apt:
name:
- nginx
- python3-pip
- supervisor
state: present
update_cache: yes
# Configuration via Jinja2 templates
- name: Deploy nginx configuration
ansible.builtin.template:
src: templates/nginx.conf.j2
dest: /etc/nginx/sites-available/app
owner: root
group: root
mode: '0644'
notify: Reload nginx
# Application deployment
- name: Deploy application
ansible.builtin.git:
repo: "https://github.com/org/app.git"
dest: /opt/app
version: "v{{ app_version }}"
notify: Restart application
handlers:
- name: Reload nginx
ansible.builtin.service:
name: nginx
state: reloaded
- name: Restart application
ansible.builtin.supervisorctl:
name: app
state: restartedTóm lại: Terraform cho cơ sở hạ tầng (những gì tồn tại), Ansible cho cấu hình (cách được cấu hình). Cả hai công cụ thường được kết hợp trong workflow hoàn chỉnh.
Q8: Làm thế nào để cấu trúc dự án Terraform cho tổ chức lớn?
Cấu trúc modular với việc tách biệt môi trường giúp dễ dàng bảo trì và cộng tác.
# terraform-project-structure
# Recommended structure for enterprise projects

terraform-infrastructure/
├── modules/                    # Reusable modules
│   ├── networking/
│   │   ├── main.tf
│   │   ├── variables.tf
│   │   ├── outputs.tf
│   │   └── README.md
│   ├── kubernetes/
│   │   ├── main.tf
│   │   ├── variables.tf
│   │   └── outputs.tf
│   └── database/
│       ├── main.tf
│       ├── variables.tf
│       └── outputs.tf
│
├── environments/               # Per-environment configuration
│   ├── dev/
│   │   ├── main.tf            # Calls modules
│   │   ├── variables.tf
│   │   ├── terraform.tfvars   # Dev values
│   │   └── backend.tf         # Dev state
│   ├── staging/
│   │   ├── main.tf
│   │   ├── terraform.tfvars
│   │   └── backend.tf
│   └── production/
│       ├── main.tf
│       ├── terraform.tfvars
│       └── backend.tf
│
├── shared/                     # Shared resources
│   ├── iam/
│   └── dns/
│
└── .github/
    └── workflows/
└── terraform.yml # CI/CD pipeline# environments/production/main.tf
# Example of module usage
module "networking" {
source = "../../modules/networking"
environment = "production"
vpc_cidr = var.vpc_cidr
azs = var.availability_zones
enable_flow_logs = true
}
module "kubernetes" {
source = "../../modules/kubernetes"
environment = "production"
cluster_name = "prod-cluster"
vpc_id = module.networking.vpc_id
subnet_ids = module.networking.private_subnet_ids
node_groups = var.node_groups
# Production: HA configuration
cluster_version = "1.29"
enable_cluster_autoscaler = true
}
module "database" {
source = "../../modules/database"
environment = "production"
vpc_id = module.networking.vpc_id
subnet_ids = module.networking.database_subnet_ids
instance_class = "db.r6g.xlarge"
multi_az = true # HA in production
backup_retention = 30
}Cấu trúc này cho phép: versioning module, review thay đổi theo từng môi trường, và tái sử dụng mã nguồn.
Giám sát và Khả năng quan sát
Các câu hỏi giám sát đánh giá khả năng thiết kế hệ thống có thể quan sát được.
Q9: Ba trụ cột của khả năng quan sát là gì?
Khả năng quan sát dựa vào ba loại dữ liệu bổ sung giúp hiểu trạng thái nội bộ của hệ thống.
# observability-pillars.yaml
# The three pillars of observability

pillars:
  metrics:
    description: "Numeric data aggregated over time"
    characteristics:
      - "Low cardinality"
      - "Efficient storage"
      - "Ideal for alerting"
    examples:
      - "request_count (counter)"
      - "response_time_seconds (histogram)"
      - "active_connections (gauge)"
    tools:
      - "Prometheus"
      - "Datadog"
      - "CloudWatch"
    use_cases:
      - "Real-time dashboards"
      - "Threshold alerts"
      - "Capacity planning"

  logs:
    description: "Timestamped text events"
    characteristics:
      - "High cardinality"
      - "Detailed context"
      - "Large storage"
    examples:
      - "Application errors"
      - "Audit events"
      - "Debug information"
    tools:
      - "Loki"
      - "Elasticsearch"
      - "CloudWatch Logs"
    use_cases:
      - "Debugging"
      - "Audit compliance"
      - "Root cause analysis"

  traces:
    description: "Request tracking across services"
    characteristics:
      - "End-to-end view"
      - "Context propagation"
      - "Bottleneck identification"
    examples:
      - "Distributed transaction"
      - "Service dependencies"
      - "Latency breakdown"
    tools:
      - "Jaeger"
      - "Tempo"
      - "AWS X-Ray"
    use_cases:
      - "Performance optimization"
      - "Service dependencies"
      - "Error propagation"
Q10: Làm thế nào để cấu hình cảnh báo hiệu quả?
Cảnh báo được thiết kế tốt giảm mệt mỏi và cho phép phản hồi sự cố nhanh chóng.
# prometheus-alerting-rules.yaml
# Prometheus alerting rules with best practices

groups:
  - name: application-alerts
    rules:
      # Alert on symptom, not cause
      - alert: HighErrorRate
        # Error rate > 1% over 5 minutes
        expr: |
          sum(rate(http_requests_total{status=~"5.."}[5m]))
          /
          sum(rate(http_requests_total[5m]))
          > 0.01
        for: 5m  # Avoid false positives
        labels:
          severity: critical
          team: backend
        annotations:
          summary: "High error rate detected"
          description: |
            Error rate is {{ $value | humanizePercentage }}
            for the last 5 minutes.
          runbook_url: "https://wiki.example.com/runbooks/high-error-rate"

      # Proactive alert on saturation
      - alert: DiskSpaceRunningLow
        expr: |
          (node_filesystem_avail_bytes / node_filesystem_size_bytes)
          * 100 < 20
        for: 15m
        labels:
          severity: warning
        annotations:
          summary: "Disk space below 20%"
          description: |
            Node {{ $labels.instance }} has only
            {{ $value | humanize }}% disk space remaining.

      # SLO-based alerting
      - alert: SLOBudgetBurnRate
        # Error budget consumed too quickly
        expr: |
          (
            sum(rate(http_requests_total{status=~"5.."}[1h]))
            /
            sum(rate(http_requests_total[1h]))
          ) > (1 - 0.999) * 14.4
        for: 5m
        labels:
          severity: critical
        annotations:
          summary: "SLO budget burning too fast"
          description: |
            At current error rate, monthly SLO budget will be
exhausted in less than 2 days.# alertmanager-config.yaml
# AlertManager configuration with intelligent routing
global:
resolve_timeout: 5m
route:
receiver: default
group_by: [alertname, cluster, service]
group_wait: 30s # Wait to group alerts
group_interval: 5m # Interval between grouped notifications
repeat_interval: 4h # Re-alert if not resolved
routes:
# Critical alerts: immediate notification
- match:
severity: critical
receiver: pagerduty-critical
continue: true # Also notify Slack
# Alerts by team
- match:
team: backend
receiver: slack-backend
- match:
team: infrastructure
receiver: slack-infra
receivers:
- name: pagerduty-critical
pagerduty_configs:
- service_key: <pagerduty-key>
severity: critical
- name: slack-backend
slack_configs:
- channel: '#alerts-backend'
send_resolved: true
title: '{{ .Status | toUpper }}: {{ .CommonAnnotations.summary }}'
text: '{{ .CommonAnnotations.description }}'Các nguyên tắc chính: cảnh báo dựa trên triệu chứng (tác động đến người dùng) thay vì nguyên nhân, bao gồm runbook, và điều chỉnh ngưỡng theo SLO.
Bảo mật và Tuân thủ
Các câu hỏi bảo mật đánh giá hiểu biết về rủi ro và biện pháp đối phó.
Q11: Làm thế nào để bảo mật Kubernetes cluster?
Bảo mật Kubernetes bao gồm nhiều lớp: mạng, xác thực, workload và dữ liệu.
# kubernetes-security-policies.yaml
# NetworkPolicy: network isolation between namespaces

apiVersion: networking.k8s.io/v1
kind: NetworkPolicy
metadata:
  name: default-deny-all
  namespace: production
spec:
  # Applied to all pods in namespace
  podSelector: {}
  policyTypes:
    - Ingress
    - Egress
  # No traffic allowed by default
  ingress: []
  egress: []
---
# Allow only necessary traffic
apiVersion: networking.k8s.io/v1
kind: NetworkPolicy
metadata:
  name: api-network-policy
  namespace: production
spec:
  podSelector:
    matchLabels:
      app: api
  policyTypes:
    - Ingress
    - Egress
  ingress:
    # Accept only from ingress controller
    - from:
        - namespaceSelector:
            matchLabels:
              name: ingress-nginx
      ports:
        - protocol: TCP
          port: 8080
  egress:
    # Allow to database
    - to:
        - podSelector:
            matchLabels:
              app: postgres
      ports:
        - protocol: TCP
          port: 5432
    # Allow DNS
    - to:
        - namespaceSelector: {}
          podSelector:
            matchLabels:
              k8s-app: kube-dns
      ports:
        - protocol: UDP
port: 53# pod-security-standards.yaml
# PodSecurity: workload restrictions
apiVersion: v1
kind: Namespace
metadata:
name: production
labels:
# Enforce: blocks violations
pod-security.kubernetes.io/enforce: restricted
# Warn: warns without blocking
pod-security.kubernetes.io/warn: restricted
# Audit: logs violations
pod-security.kubernetes.io/audit: restricted
---
# Pod compliant with "restricted" standards
apiVersion: v1
kind: Pod
metadata:
name: secure-pod
namespace: production
spec:
securityContext:
runAsNonRoot: true
runAsUser: 1000
fsGroup: 1000
seccompProfile:
type: RuntimeDefault
containers:
- name: app
image: myapp:latest
securityContext:
allowPrivilegeEscalation: false
readOnlyRootFilesystem: true
capabilities:
drop:
- ALL
resources:
limits:
memory: "256Mi"
cpu: "500m"
requests:
memory: "128Mi"
cpu: "250m"
volumeMounts:
- name: tmp
mountPath: /tmp
volumes:
- name: tmp
emptyDir: {}Bảo mật Kubernetes kết hợp nhiều lớp: RBAC cho phân quyền, NetworkPolicies cho cách ly mạng, PodSecurity cho hạn chế workload, và mã hóa secret khi lưu trữ.
Q12: Nguyên tắc đặc quyền tối thiểu là gì và cách áp dụng?
Nguyên tắc này quy định rằng người dùng hoặc hệ thống chỉ nên có quyền tối thiểu cần thiết để hoàn thành nhiệm vụ của mình.
# rbac-least-privilege.yaml
# Kubernetes RBAC with minimal permissions

# Role: permissions in a specific namespace
apiVersion: rbac.authorization.k8s.io/v1
kind: Role
metadata:
  namespace: production
  name: deployment-manager
rules:
  # Pod reading (for monitoring)
  - apiGroups: [""]
    resources: ["pods", "pods/log"]
    verbs: ["get", "list", "watch"]
  # Deployment management only
  - apiGroups: ["apps"]
    resources: ["deployments"]
    verbs: ["get", "list", "watch", "update", "patch"]
  # No create/delete on deployments
  # No access to secrets or sensitive configmaps
---
# RoleBinding: Role <-> ServiceAccount association
apiVersion: rbac.authorization.k8s.io/v1
kind: RoleBinding
metadata:
  name: deployment-manager-binding
  namespace: production
subjects:
  - kind: ServiceAccount
    name: ci-cd-deployer
    namespace: production
roleRef:
  kind: Role
  name: deployment-manager
  apiGroup: rbac.authorization.k8s.io
---
# Dedicated ServiceAccount for CI/CD
apiVersion: v1
kind: ServiceAccount
metadata:
  name: ci-cd-deployer
  namespace: production
  annotations:
    # Automatic token expiration
    kubernetes.io/enforce-mountable-secrets: "true"
Nguyên tắc này cũng áp dụng cho AWS IAM, database và quyền truy cập mạng.
SRE và Độ tin cậy
Các câu hỏi SRE đánh giá hiểu biết về thực tiễn độ tin cậy và quản lý sự cố.
Q13: SLO là gì và làm thế nào để định nghĩa nó?
Service Level Objectives (SLO) định lượng độ tin cậy kỳ vọng của một dịch vụ và hướng dẫn các quyết định kỹ thuật.
# slo-definitions.yaml
# SLO definitions for an API service

service: payment-api
owner: payments-team

slos:
  - name: availability
    description: "Service responds successfully to requests"
    sli:
      # SLI: measured metric
      type: availability
      good_events: "http_requests_total{status=~'2..'}"
      total_events: "http_requests_total"
    target: 99.9%  # SLO: objective
    window: 30d    # Measurement window
    # Error budget: 0.1% = 43.2 minutes/month
    error_budget:
      monthly_minutes: 43.2

  - name: latency
    description: "Response time below threshold"
    sli:
      type: latency
      good_events: "http_request_duration_seconds_bucket{le='0.3'}"
      total_events: "http_request_duration_seconds_count"
    target: 99%  # 99% of requests < 300ms
    window: 30d

  - name: throughput
    description: "Ability to process transactions"
    sli:
      type: throughput
      query: "sum(rate(transactions_processed_total[5m]))"
    target: ">= 1000 TPS"

# Actions based on error budget
error_budget_policy:
  - condition: "remaining > 50%"
    actions:
      - "Feature development prioritized"
      - "Experimentation allowed"
  - condition: "remaining 20-50%"
    actions:
      - "Balance features and reliability"
      - "Increase testing coverage"
  - condition: "remaining < 20%"
    actions:
      - "Freeze non-critical deployments"
      - "Focus on reliability improvements"
  - condition: "exhausted"
    actions:
      - "Incident response mode"
      - "All hands on reliability"
SLO cho phép đưa ra quyết định khách quan: triển khai tính năng mới hay củng cố độ tin cậy.
Q14: Làm thế nào để thực hiện post-mortem hiệu quả?
Post-mortem blameless thúc đẩy học hỏi và ngăn ngừa sự cố trong tương lai.
# postmortem-template.yaml
# Blameless post-mortem template

incident:
  id: "INC-2026-0042"
  title: "Payment service unavailability"
  severity: SEV1
  duration: "45 minutes"
  date: "2026-01-15"

# Factual timeline
timeline:
  - time: "14:32"
    event: "Alert: error rate > 5% on payment-api"
    actor: "PagerDuty"
  - time: "14:35"
    event: "Incident declared, team notified"
    actor: "On-call engineer"
  - time: "14:42"
    event: "Cause identified: connection pool exhausted"
    actor: "Backend team"
  - time: "14:55"
    event: "Mitigation: deployment rollback"
    actor: "Backend team"
  - time: "15:17"
    event: "Service restored, monitoring stable"
    actor: "Backend team"

# Measurable impact
impact:
  users_affected: 12500
  transactions_failed: 847
  revenue_impact: "~$16,500"
  slo_budget_consumed: "2.3 days"

# Root cause analysis (5 Whys)
root_cause_analysis:
  - question: "Why was the service unavailable?"
    answer: "DB connections were exhausted"
  - question: "Why were connections exhausted?"
    answer: "A slow query was blocking connections"
  - question: "Why was there a slow query?"
    answer: "Missing index on a new table"
  - question: "Why was the index missing?"
    answer: "Incomplete migration deployed"
  - question: "Why was the migration incomplete?"
    answer: "No execution plan validation in staging"

# Corrective actions
action_items:
  - id: "AI-001"
    type: "prevent"
    description: "Add SQL execution plan validation in CI"
    owner: "DBA team"
    due_date: "2026-01-22"
    priority: P1

  - id: "AI-002"
    type: "detect"
    description: "Alert on connection pool usage > 80%"
    owner: "SRE team"
    due_date: "2026-01-18"
    priority: P1

  - id: "AI-003"
    type: "mitigate"
    description: "Implement circuit breaker on DB queries"
    owner: "Backend team"
    due_date: "2026-01-29"
    priority: P2

# Lessons learned
lessons_learned:
  what_went_well:
    - "Fast detection thanks to alerting (< 3 min)"
    - "Clear communication in incident channel"
    - "Rollback completed in less than 15 minutes"
  what_went_poorly:
    - "No load testing on new endpoint"
    - "Staging didn't reflect prod data volume"
  lucky:
    - "Incident during daytime with full team available"
Mục tiêu là cải thiện hệ thống, không phải tìm người đổ lỗi. Các hành động được phân loại thành ba loại: phòng ngừa, phát hiện và giảm thiểu.
Bắt đầu luyện tập!
Kiểm tra kiến thức với mô phỏng phỏng vấn và bài kiểm tra kỹ thuật.
Kết luận
Phỏng vấn DevOps bao gồm một phổ rộng các kỹ năng, từ văn hóa đến công cụ kỹ thuật. Chìà khóa thành công nằm ở việc thể hiện hiểu biết sâu sắc về các khái niệm, được minh họa bằng các ví dụ triển khai thực tế.
Checklist chuẩn bị
- ✅ Nắm vững các khái niệm CI/CD và có thể thiết kế pipeline hoàn chỉnh
- ✅ Hiểu kiến trúc Kubernetes và có thể debug các vấn đề thường gặp
- ✅ Biết các công cụ IaC (Terraform, Ansible) và trường hợp sử dụng tương ứng
- ✅ Biết cách cấu hình giám sát và định nghĩa cảnh báo phù hợp
- ✅ Áp dụng các thực tiễn bảo mật tốt nhất (đặc quyền tối thiểu, defense in depth)
- ✅ Giải thích được các thực tiễn SRE (SLO, error budget, post-mortem)
- ✅ Có ví dụ thực tế về giải quyết vấn đề
- ✅ Có thể giải thích các khái niệm phức tạp một cách đơn giản
Thẻ
Chia sẻ
Bài viết liên quan
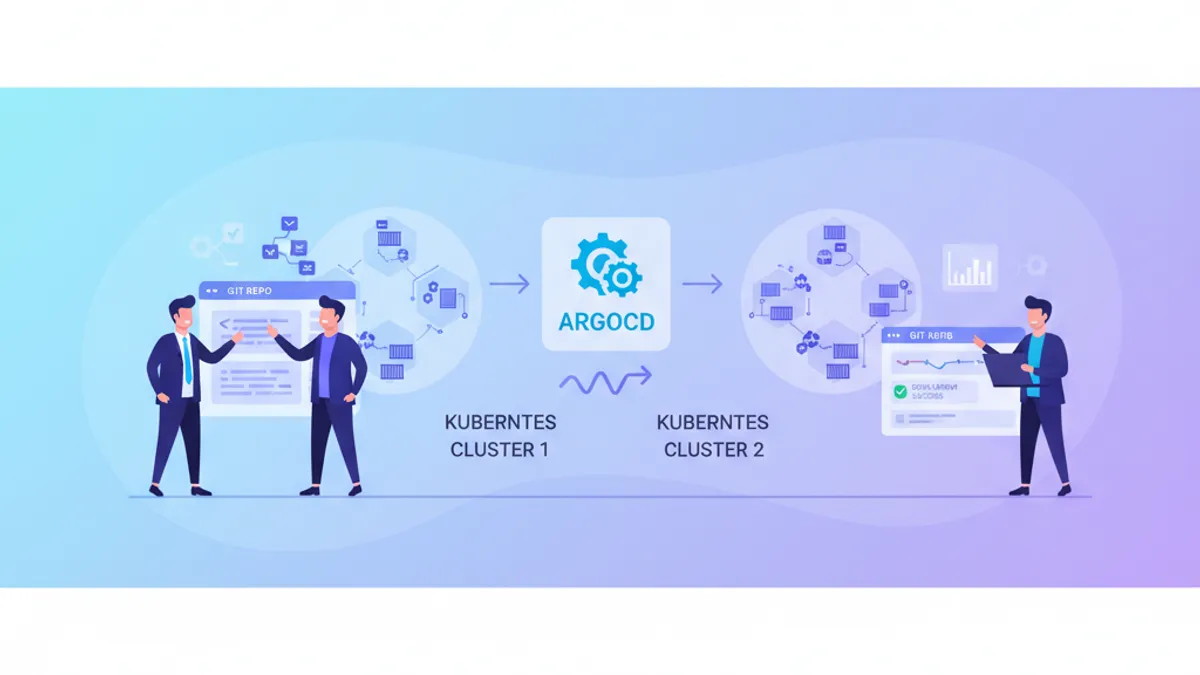
ArgoCD và GitOps cho Kubernetes: Hướng dẫn triển khai liên tục và câu hỏi phỏng vấn 2026
Tìm hiểu cách sử dụng ArgoCD để triển khai GitOps trên Kubernetes. Bài viết bao gồm cấu hình Application, Sync Waves, ApplicationSet và các câu hỏi phỏng vấn thường gặp.

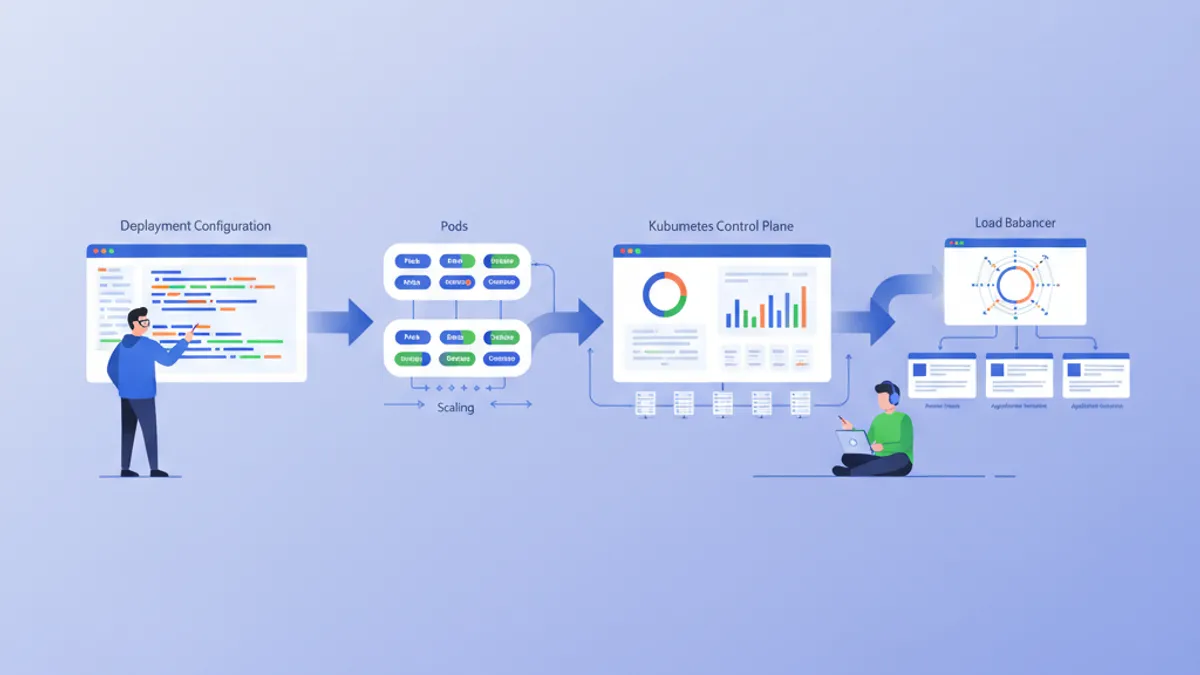
Phong van Kubernetes: Giai thich chi tiet Pods, Services va Deployments
Cac cau hoi phong van Kubernetes ve Pods, Services va Deployments — voi vi du YAML, co che networking noi bo va chien luoc scaling cho nam 2026.
Kubernetes: Triển khai ứng dụng đầu tiên
Hướng dẫn thực hành để triển khai ứng dụng trên Kubernetes. Từ cài đặt minikube đến Deployments, Services và ConfigMaps với các ví dụ cụ thể.