Ключові питання на DevOps-співбесіді: повний посібник 2026
Підготовка до DevOps-співбесіди: найважливіші питання про CI/CD, Kubernetes, Docker, Terraform та SRE-практики з розгорнутими відповідями.
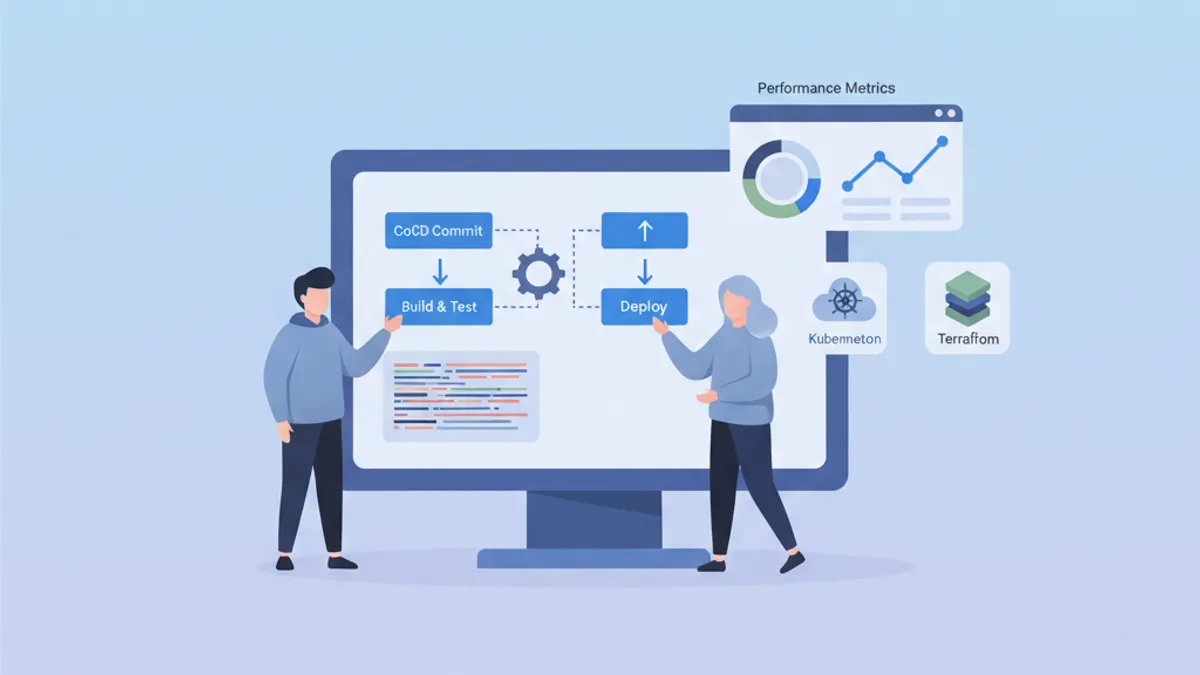
Співбесіди на DevOps-позиції перевіряють поєднання навичок розробки, адміністрування та культури автоматизації. Цей посібник охоплює найпоширеніші питання, згруповані за напрямками, з розгорнутими відповідями, що демонструють глибоке розуміння концепцій.
Окрім технічних знань, рекрутери оцінюють здатність пояснювати складні концепції просто та ділитися конкретним досвідом розв'язання проблем.
Основи та культура DevOps
Початкові запитання зазвичай перевіряють загальне розуміння DevOps-філософії.
Q1: Що таке DevOps і які проблеми вирішує цей підхід?
DevOps — це культура та набір практик, що об'єднують розробку програмного забезпечення (Dev) і IT-операції (Ops). Мета підходу — скоротити цикл розробки, зберігаючи при цьому високу якість продукту.
# devops-principles.yaml
# The pillars of DevOps culture
principles:
  collaboration:
    description: "Breaking silos between teams"
    practices:
      - "Shared responsibility for production code"
      - "Continuous communication via ChatOps"
      - "Blameless post-mortems"

  automation:
    description: "Automate repetitive tasks"
    practices:
      - "Infrastructure as Code (IaC)"
      - "CI/CD pipelines"
      - "Automated testing at all levels"

  measurement:
    description: "Measure to improve"
    metrics:
      - "Deployment frequency"
      - "Lead time for changes"
      - "Mean time to recovery (MTTR)"
      - "Change failure rate"

  sharing:
    description: "Share knowledge"
    practices:
      - "Documentation as Code"
      - "Automated runbooks"
      - "Regular knowledge sharing sessions"
DevOps вирішує проблеми повільних і ризикованих деплоїв, відсутності видимості між командами та розходжень між середовищами.
Q2: У чому різниця між CI, CD (Continuous Delivery) і CD (Continuous Deployment)?
Ці три концепції утворюють прогресію в автоматизації циклу постачання.
# ci-cd-pipeline-stages.sh
# Illustration of CI/CD stages

# ============================================
# CI (Continuous Integration)
# ============================================
# Goal: Frequently integrate code into a shared repository
# Automation: Build + Tests
echo "CI: Code commit → Build → Unit Tests → Integration Tests"

# ============================================
# CD (Continuous Delivery)
# ============================================
# Goal: Code always deployable to production
# Automation: CI + Staging deployment + Manual approval
echo "CD Delivery: CI → Deploy Staging → Manual Approval → Deploy Prod"

# ============================================
# CD (Continuous Deployment)
# ============================================
# Goal: Automatic deployment to production
# Automation: Entire pipeline without human intervention
echo "CD Deployment: CI → Deploy Staging → Auto Tests → Auto Deploy Prod"
Ключова відмінність — у рівні автоматизації: Continuous Delivery вимагає ручного підтвердження перед продакшном, тоді як Continuous Deployment автоматизує весь процес без втручання людини.
CI/CD та пайплайни
Запитання з CI/CD перевіряють здатність проєктувати та оптимізувати пайплайни постачання.
Q3: Як побудувати надійний CI/CD-пайплайн?
Добре спроєктований пайплайн проходить послідовні етапи з контрольними точками на кожному рівні.
# .gitlab-ci.yml
# Complete CI/CD pipeline with parallel and sequential stages
stages:
  - validate
  - build
  - test
  - security
  - deploy-staging
  - integration-tests
  - deploy-production

variables:
  DOCKER_IMAGE: $CI_REGISTRY_IMAGE:$CI_COMMIT_SHA

# ============================================
# Stage 1: Fast validation (< 2 min)
# ============================================
lint:
  stage: validate
  script:
    - npm run lint
    - npm run type-check
  # Run on every commit
  rules:
    - if: $CI_PIPELINE_SOURCE == "merge_request_event"
    - if: $CI_COMMIT_BRANCH

# ============================================
# Stage 2: Application build
# ============================================
build:
  stage: build
  script:
    - docker build -t $DOCKER_IMAGE .
    - docker push $DOCKER_IMAGE
  # Cache Docker layers to speed up builds
  cache:
    key: docker-$CI_COMMIT_REF_SLUG
    paths:
      - .docker-cache/

# ============================================
# Stage 3: Parallel tests
# ============================================
unit-tests:
  stage: test
  script:
    - npm run test:unit -- --coverage
  coverage: '/Lines\s*:\s*(\d+\.?\d*)%/'
  artifacts:
    reports:
      coverage_report:
        coverage_format: cobertura
        path: coverage/cobertura-coverage.xml

integration-tests:
  stage: test
  services:
    - postgres:16-alpine
    - redis:7-alpine
  script:
    - npm run test:integration
  # Parallelization with unit tests
  parallel: 3

# ============================================
# Stage 4: Security analysis
# ============================================
sast:
  stage: security
  script:
    - trivy image --exit-code 1 --severity HIGH,CRITICAL $DOCKER_IMAGE
  allow_failure: false

dependency-scan:
  stage: security
  script:
    - npm audit --audit-level=high
  allow_failure: true  # Alert without blocking

# ============================================
# Stage 5: Staging deployment
# ============================================
deploy-staging:
  stage: deploy-staging
  script:
    - kubectl set image deployment/app app=$DOCKER_IMAGE -n staging
    - kubectl rollout status deployment/app -n staging --timeout=300s
  environment:
    name: staging
    url: https://staging.example.com
  only:
    - develop

# ============================================
# Stage 6: E2E tests on staging
# ============================================
e2e-tests:
  stage: integration-tests
  script:
    - npm run test:e2e -- --base-url=https://staging.example.com
  artifacts:
    when: on_failure
    paths:
      - cypress/screenshots/
      - cypress/videos/
  only:
    - develop

# ============================================
# Stage 7: Production deployment
# ============================================
deploy-production:
  stage: deploy-production
  script:
    - kubectl set image deployment/app app=$DOCKER_IMAGE -n production
    - kubectl rollout status deployment/app -n production --timeout=300s
  environment:
    name: production
    url: https://app.example.com
  # Manual deployment with protection
  when: manual
  only:
    - main
Цей пайплайн демонструє найкращі практики: паралельні етапи для швидкості, артефакти для трасованості та захищені середовища для продакшну.
Q4: Як керувати секретами в CI/CD-пайплайні?
Управління секретами вимагає багаторівневого підходу, що поєднує шифрування, ротацію та принцип мінімальних привілеїв.
# kubernetes-secrets-management.yaml
# Approach 1: External Secrets Operator with HashiCorp Vault
apiVersion: external-secrets.io/v1beta1
kind: ExternalSecret
metadata:
  name: app-secrets
  namespace: production
spec:
  refreshInterval: 1h  # Automatic rotation
  secretStoreRef:
    name: vault-backend
    kind: ClusterSecretStore
  target:
    name: app-secrets
    creationPolicy: Owner
  data:
    # Reference to secret in Vault
    - secretKey: DATABASE_PASSWORD
      remoteRef:
        key: secret/data/production/database
        property: password
    - secretKey: API_KEY
      remoteRef:
        key: secret/data/production/api
        property: key
---
# SecretStore configuration
apiVersion: external-secrets.io/v1beta1
kind: ClusterSecretStore
metadata:
  name: vault-backend
spec:
  provider:
    vault:
      server: "https://vault.example.com"
      path: "secret"
      version: "v2"
      auth:
        kubernetes:
          mountPath: "kubernetes"
          role: "external-secrets"
          # Dedicated ServiceAccount with minimal permissions
          serviceAccountRef:
            name: external-secrets-sa
Рекомендовані практики: ніколи не зберігати секрети у відкритому вигляді в коді, використовувати спеціалізовані сховища секретів (Vault, AWS Secrets Manager) та вмикати автоматичну ротацію.
Слід уникати змінних середовища CI/CD, видимих у логах. Секрети необхідно завжди маскувати засобами платформи CI (masked variables).
Kubernetes та оркестрація
Запитання щодо Kubernetes оцінюють розуміння концепцій оркестрації та здатність розв'язувати конкретні задачі.
Q5: Поясніть архітектуру Kubernetes і роль кожного компонента.
Kubernetes дотримується архітектури master-node, де кожен компонент має чітко визначену відповідальність.
# kubernetes-architecture.yaml
# Control Plane components (Master)
control_plane:
  api_server:
    role: "Entry point for all API requests"
    responsibilities:
      - "Validation and configuration of API objects"
      - "Authentication and authorization"
      - "REST interface for kubectl and other clients"

  etcd:
    role: "Distributed key-value database"
    responsibilities:
      - "Cluster state storage"
      - "Source of truth for configuration"
      - "Consensus via Raft algorithm"

  scheduler:
    role: "Assigning Pods to nodes"
    responsibilities:
      - "Evaluating constraints (resources, affinity)"
      - "Selecting the optimal node"
      - "Respecting PodDisruptionBudgets"

  controller_manager:
    role: "Control loops for desired state"
    controllers:
      - "ReplicaSet Controller"
      - "Deployment Controller"
      - "Service Controller"
      - "Node Controller"

# Worker Node components
worker_nodes:
  kubelet:
    role: "Agent on each node"
    responsibilities:
      - "Communication with Control Plane"
      - "Pod lifecycle management"
      - "Node status reporting"

  kube_proxy:
    role: "Network proxy on each node"
    responsibilities:
      - "iptables/IPVS rules for Services"
      - "Intra-cluster load balancing"

  container_runtime:
    role: "Container execution"
    options:
      - "containerd (recommended)"
      - "CRI-O"
Ця архітектура забезпечує високу доступність: Control Plane можна реплікувати, а навантаження розподіляється між Worker Nodes.
Q6: Як налагодити Pod, який не запускається?
Відлагодження в Kubernetes передбачає методичний аналіз різних рівнів системи.
# kubernetes-debugging.sh
# Workflow for debugging a failing Pod

# Step 1: Check Pod status
kubectl get pod my-app-pod -o wide
# STATUS: CrashLoopBackOff, ImagePullBackOff, Pending, etc.

# Step 2: Pod details and events
kubectl describe pod my-app-pod
# Important sections:
# - Conditions (PodScheduled, Initialized, Ready)
# - Events (scheduling, pull errors, etc.)

# Step 3: Container logs
kubectl logs my-app-pod --previous  # Previous crash logs
kubectl logs my-app-pod -c init-container  # Init container logs

# Step 4: Interactive execution for debugging
kubectl exec -it my-app-pod -- sh
# Check: env vars, mounted files, network

# Step 5: Check available resources
kubectl describe node <node-name>
# Sections: Allocatable, Allocated resources

# Step 6: Debug with ephemeral Pod (K8s 1.25+)
kubectl debug my-app-pod -it --image=busybox --share-processes
Найпоширеніші причини: нестача ресурсів, відсутність образу, відсутні секрети або неправильно налаштовані проби.
# pod-debugging-checklist.yaml
# Debugging checklist by status
debugging_by_status:
  Pending:
    causes:
      - "Insufficient resources on nodes"
      - "PersistentVolumeClaim not bound"
      - "Affinity/Taints not satisfied"
    commands:
      - "kubectl describe pod <name> | grep -A 20 Events"
      - "kubectl get pvc"
      - "kubectl describe nodes | grep -A 5 Allocated"

  ImagePullBackOff:
    causes:
      - "Non-existent image or incorrect tag"
      - "Private registry without imagePullSecrets"
      - "Docker Hub rate limiting"
    commands:
      - "kubectl get events --field-selector reason=Failed"
      - "kubectl get secret <pull-secret> -o yaml"

  CrashLoopBackOff:
    causes:
      - "Application error at startup"
      - "Missing configuration (env vars, configmaps)"
      - "Liveness probe too aggressive"
    commands:
      - "kubectl logs <pod> --previous"
      - "kubectl describe pod <pod> | grep -A 10 Liveness"

  OOMKilled:
    causes:
      - "Memory limit too low"
      - "Memory leak in application"
    commands:
      - "kubectl describe pod <pod> | grep -A 5 Last State"
      - "kubectl top pod <pod>"
Готовий до співбесід з DevOps?
Практикуйся з нашими інтерактивними симуляторами, flashcards та технічними тестами.
Інфраструктура як код
Запитання про IaC перевіряють знання інструментів provisioning та найкращих практик.
Q7: Terraform проти Ansible: коли використовувати кожен інструмент?
Ці інструменти мають різну філософію та випадки застосування.
# terraform-example.tf
# Terraform: Infrastructure provisioning (declarative)
# Ideal for: cloud resources, networking, infrastructure state

terraform {
  required_providers {
    aws = {
      source  = "hashicorp/aws"
      version = "~> 5.0"
    }
  }
  # Remote state for collaboration
  backend "s3" {
    bucket         = "terraform-state-prod"
    key            = "infrastructure/terraform.tfstate"
    region         = "eu-west-1"
    dynamodb_table = "terraform-locks"
    encrypt        = true
  }
}

# Declarative resource: Terraform manages the lifecycle
resource "aws_eks_cluster" "main" {
  name     = "production-cluster"
  role_arn = aws_iam_role.eks_cluster.arn
  version  = "1.29"

  vpc_config {
    subnet_ids              = module.vpc.private_subnets
    endpoint_private_access = true
    endpoint_public_access  = false
  }

  # Implicit dependencies managed by Terraform
  depends_on = [
    aws_iam_role_policy_attachment.eks_cluster_policy
  ]
}

# Reusable modules for standardization
module "vpc" {
  source  = "terraform-aws-modules/vpc/aws"
  version = "5.0.0"

  name = "production-vpc"
  cidr = "10.0.0.0/16"

  azs             = ["eu-west-1a", "eu-west-1b", "eu-west-1c"]
  private_subnets = ["10.0.1.0/24", "10.0.2.0/24", "10.0.3.0/24"]
  public_subnets  = ["10.0.101.0/24", "10.0.102.0/24", "10.0.103.0/24"]

  enable_nat_gateway = true
  single_nat_gateway = false  # HA: one NAT per AZ
}# ansible-example.yml
# Ansible: Configuration management (procedural/declarative)
# Ideal for: OS configuration, app deployment, orchestration
---
- name: Configure application servers
hosts: app_servers
become: yes
vars:
app_version: "2.5.0"
tasks:
# System package management
- name: Install required packages
ansible.builtin.apt:
name:
- nginx
- python3-pip
- supervisor
state: present
update_cache: yes
# Configuration via Jinja2 templates
- name: Deploy nginx configuration
ansible.builtin.template:
src: templates/nginx.conf.j2
dest: /etc/nginx/sites-available/app
owner: root
group: root
mode: '0644'
notify: Reload nginx
# Application deployment
- name: Deploy application
ansible.builtin.git:
repo: "https://github.com/org/app.git"
dest: /opt/app
version: "v{{ app_version }}"
notify: Restart application
handlers:
- name: Reload nginx
ansible.builtin.service:
name: nginx
state: reloaded
- name: Restart application
ansible.builtin.supervisorctl:
name: app
state: restartedПідсумок: Terraform — для інфраструктури (що існує), Ansible — для конфігурації (як налаштовано). Обидва інструменти часто поєднуються в єдиному робочому процесі.
Q8: Як структурувати Terraform-проєкт для великої організації?
Модульна структура з розділенням середовищ спрощує підтримку та командну співпрацю.
# terraform-project-structure
# Recommended structure for enterprise projects

terraform-infrastructure/
├── modules/                    # Reusable modules
│   ├── networking/
│   │   ├── main.tf
│   │   ├── variables.tf
│   │   ├── outputs.tf
│   │   └── README.md
│   ├── kubernetes/
│   │   ├── main.tf
│   │   ├── variables.tf
│   │   └── outputs.tf
│   └── database/
│       ├── main.tf
│       ├── variables.tf
│       └── outputs.tf
│
├── environments/               # Per-environment configuration
│   ├── dev/
│   │   ├── main.tf            # Calls modules
│   │   ├── variables.tf
│   │   ├── terraform.tfvars   # Dev values
│   │   └── backend.tf         # Dev state
│   ├── staging/
│   │   ├── main.tf
│   │   ├── terraform.tfvars
│   │   └── backend.tf
│   └── production/
│       ├── main.tf
│       ├── terraform.tfvars
│       └── backend.tf
│
├── shared/                     # Shared resources
│   ├── iam/
│   └── dns/
│
└── .github/
    └── workflows/
└── terraform.yml # CI/CD pipeline# environments/production/main.tf
# Example of module usage
module "networking" {
source = "../../modules/networking"
environment = "production"
vpc_cidr = var.vpc_cidr
azs = var.availability_zones
enable_flow_logs = true
}
module "kubernetes" {
source = "../../modules/kubernetes"
environment = "production"
cluster_name = "prod-cluster"
vpc_id = module.networking.vpc_id
subnet_ids = module.networking.private_subnet_ids
node_groups = var.node_groups
# Production: HA configuration
cluster_version = "1.29"
enable_cluster_autoscaler = true
}
module "database" {
source = "../../modules/database"
environment = "production"
vpc_id = module.networking.vpc_id
subnet_ids = module.networking.database_subnet_ids
instance_class = "db.r6g.xlarge"
multi_az = true # HA in production
backup_retention = 30
}Така структура уможливлює версіонування модулів, рев'ю змін по середовищах та повторне використання коду.
Моніторинг та спостережуваність
Запитання про моніторинг перевіряють здатність проєктувати спостережувані системи.
Q9: Які три стовпи спостережуваності?
Спостережуваність базується на трьох взаємодоповнювальних типах даних, що допомагають зрозуміти внутрішній стан системи.
# observability-pillars.yaml
# The three pillars of observability

pillars:
  metrics:
    description: "Numeric data aggregated over time"
    characteristics:
      - "Low cardinality"
      - "Efficient storage"
      - "Ideal for alerting"
    examples:
      - "request_count (counter)"
      - "response_time_seconds (histogram)"
      - "active_connections (gauge)"
    tools:
      - "Prometheus"
      - "Datadog"
      - "CloudWatch"
    use_cases:
      - "Real-time dashboards"
      - "Threshold alerts"
      - "Capacity planning"

  logs:
    description: "Timestamped text events"
    characteristics:
      - "High cardinality"
      - "Detailed context"
      - "Large storage"
    examples:
      - "Application errors"
      - "Audit events"
      - "Debug information"
    tools:
      - "Loki"
      - "Elasticsearch"
      - "CloudWatch Logs"
    use_cases:
      - "Debugging"
      - "Audit compliance"
      - "Root cause analysis"

  traces:
    description: "Request tracking across services"
    characteristics:
      - "End-to-end view"
      - "Context propagation"
      - "Bottleneck identification"
    examples:
      - "Distributed transaction"
      - "Service dependencies"
      - "Latency breakdown"
    tools:
      - "Jaeger"
      - "Tempo"
      - "AWS X-Ray"
    use_cases:
      - "Performance optimization"
      - "Service dependencies"
      - "Error propagation"
Q10: Як налаштувати ефективні алерти?
Добре спроєктовані алерти зменшують alert fatigue та забезпечують швидке реагування на інциденти.
# prometheus-alerting-rules.yaml
# Prometheus alerting rules with best practices

groups:
  - name: application-alerts
    rules:
      # Alert on symptom, not cause
      - alert: HighErrorRate
        # Error rate > 1% over 5 minutes
        expr: |
          sum(rate(http_requests_total{status=~"5.."}[5m]))
          /
          sum(rate(http_requests_total[5m]))
          > 0.01
        for: 5m  # Avoid false positives
        labels:
          severity: critical
          team: backend
        annotations:
          summary: "High error rate detected"
          description: |
            Error rate is {{ $value | humanizePercentage }}
            for the last 5 minutes.
          runbook_url: "https://wiki.example.com/runbooks/high-error-rate"

      # Proactive alert on saturation
      - alert: DiskSpaceRunningLow
        expr: |
          (node_filesystem_avail_bytes / node_filesystem_size_bytes)
          * 100 < 20
        for: 15m
        labels:
          severity: warning
        annotations:
          summary: "Disk space below 20%"
          description: |
            Node {{ $labels.instance }} has only
            {{ $value | humanize }}% disk space remaining.

      # SLO-based alerting
      - alert: SLOBudgetBurnRate
        # Error budget consumed too quickly
        expr: |
          (
            sum(rate(http_requests_total{status=~"5.."}[1h]))
            /
            sum(rate(http_requests_total[1h]))
          ) > (1 - 0.999) * 14.4
        for: 5m
        labels:
          severity: critical
        annotations:
          summary: "SLO budget burning too fast"
          description: |
            At current error rate, monthly SLO budget will be
exhausted in less than 2 days.# alertmanager-config.yaml
# AlertManager configuration with intelligent routing
global:
resolve_timeout: 5m
route:
receiver: default
group_by: [alertname, cluster, service]
group_wait: 30s # Wait to group alerts
group_interval: 5m # Interval between grouped notifications
repeat_interval: 4h # Re-alert if not resolved
routes:
# Critical alerts: immediate notification
- match:
severity: critical
receiver: pagerduty-critical
continue: true # Also notify Slack
# Alerts by team
- match:
team: backend
receiver: slack-backend
- match:
team: infrastructure
receiver: slack-infra
receivers:
- name: pagerduty-critical
pagerduty_configs:
- service_key: <pagerduty-key>
severity: critical
- name: slack-backend
slack_configs:
- channel: '#alerts-backend'
send_resolved: true
title: '{{ .Status | toUpper }}: {{ .CommonAnnotations.summary }}'
text: '{{ .CommonAnnotations.description }}'Ключові принципи: сигналізувати про симптоми (вплив на користувача), а не причини, включати runbooks і налаштовувати пороги відповідно до SLO.
Безпека та відповідність
Запитання щодо безпеки перевіряють розуміння ризиків та заходів протидії.
Q11: Як захистити Kubernetes-кластер?
Безпека Kubernetes охоплює кілька рівнів: мережу, автентифікацію, навантаження та дані.
# kubernetes-security-policies.yaml
# NetworkPolicy: network isolation between namespaces

apiVersion: networking.k8s.io/v1
kind: NetworkPolicy
metadata:
  name: default-deny-all
  namespace: production
spec:
  # Applied to all pods in namespace
  podSelector: {}
  policyTypes:
    - Ingress
    - Egress
  # No traffic allowed by default
  ingress: []
  egress: []
---
# Allow only necessary traffic
apiVersion: networking.k8s.io/v1
kind: NetworkPolicy
metadata:
  name: api-network-policy
  namespace: production
spec:
  podSelector:
    matchLabels:
      app: api
  policyTypes:
    - Ingress
    - Egress
  ingress:
    # Accept only from ingress controller
    - from:
        - namespaceSelector:
            matchLabels:
              name: ingress-nginx
      ports:
        - protocol: TCP
          port: 8080
  egress:
    # Allow to database
    - to:
        - podSelector:
            matchLabels:
              app: postgres
      ports:
        - protocol: TCP
          port: 5432
    # Allow DNS
    - to:
        - namespaceSelector: {}
          podSelector:
            matchLabels:
              k8s-app: kube-dns
      ports:
        - protocol: UDP
port: 53# pod-security-standards.yaml
# PodSecurity: workload restrictions
apiVersion: v1
kind: Namespace
metadata:
name: production
labels:
# Enforce: blocks violations
pod-security.kubernetes.io/enforce: restricted
# Warn: warns without blocking
pod-security.kubernetes.io/warn: restricted
# Audit: logs violations
pod-security.kubernetes.io/audit: restricted
---
# Pod compliant with "restricted" standards
apiVersion: v1
kind: Pod
metadata:
name: secure-pod
namespace: production
spec:
securityContext:
runAsNonRoot: true
runAsUser: 1000
fsGroup: 1000
seccompProfile:
type: RuntimeDefault
containers:
- name: app
image: myapp:latest
securityContext:
allowPrivilegeEscalation: false
readOnlyRootFilesystem: true
capabilities:
drop:
- ALL
resources:
limits:
memory: "256Mi"
cpu: "500m"
requests:
memory: "128Mi"
cpu: "250m"
volumeMounts:
- name: tmp
mountPath: /tmp
volumes:
- name: tmp
emptyDir: {}Безпека Kubernetes поєднує кілька рівнів: RBAC для авторизації, NetworkPolicies для мережевої ізоляції, PodSecurity для обмеження навантажень та шифрування секретів на диску.
Q12: Що таке принцип мінімальних привілеїв і як його застосовувати?
Цей принцип стверджує, що користувач або система повинні мати лише мінімально необхідні дозволи для виконання своїх завдань.
# rbac-least-privilege.yaml
# Kubernetes RBAC with minimal permissions

# Role: permissions in a specific namespace
apiVersion: rbac.authorization.k8s.io/v1
kind: Role
metadata:
  namespace: production
  name: deployment-manager
rules:
  # Pod reading (for monitoring)
  - apiGroups: [""]
    resources: ["pods", "pods/log"]
    verbs: ["get", "list", "watch"]
  # Deployment management only
  - apiGroups: ["apps"]
    resources: ["deployments"]
    verbs: ["get", "list", "watch", "update", "patch"]
  # No create/delete on deployments
  # No access to secrets or sensitive configmaps
---
# RoleBinding: Role <-> ServiceAccount association
apiVersion: rbac.authorization.k8s.io/v1
kind: RoleBinding
metadata:
  name: deployment-manager-binding
  namespace: production
subjects:
  - kind: ServiceAccount
    name: ci-cd-deployer
    namespace: production
roleRef:
  kind: Role
  name: deployment-manager
  apiGroup: rbac.authorization.k8s.io
---
# Dedicated ServiceAccount for CI/CD
apiVersion: v1
kind: ServiceAccount
metadata:
  name: ci-cd-deployer
  namespace: production
  annotations:
    # Automatic token expiration
    kubernetes.io/enforce-mountable-secrets: "true"
Цей принцип однаково застосовується до AWS IAM, баз даних та мережевого доступу.
SRE та надійність
Запитання про SRE оцінюють розуміння практик надійності та управління інцидентами.
Q13: Що таке SLO і як його визначити?
Service Level Objectives (SLO) кількісно вимірюють очікувану надійність сервісу та спрямовують інженерні рішення.
# slo-definitions.yaml
# SLO definitions for an API service

service: payment-api
owner: payments-team

slos:
  - name: availability
    description: "Service responds successfully to requests"
    sli:
      # SLI: measured metric
      type: availability
      good_events: "http_requests_total{status=~'2..'}"
      total_events: "http_requests_total"
    target: 99.9%  # SLO: objective
    window: 30d    # Measurement window
    # Error budget: 0.1% = 43.2 minutes/month
    error_budget:
      monthly_minutes: 43.2

  - name: latency
    description: "Response time below threshold"
    sli:
      type: latency
      good_events: "http_request_duration_seconds_bucket{le='0.3'}"
      total_events: "http_request_duration_seconds_count"
    target: 99%  # 99% of requests < 300ms
    window: 30d

  - name: throughput
    description: "Ability to process transactions"
    sli:
      type: throughput
      query: "sum(rate(transactions_processed_total[5m]))"
    target: ">= 1000 TPS"

# Actions based on error budget
error_budget_policy:
  - condition: "remaining > 50%"
    actions:
      - "Feature development prioritized"
      - "Experimentation allowed"
  - condition: "remaining 20-50%"
    actions:
      - "Balance features and reliability"
      - "Increase testing coverage"
  - condition: "remaining < 20%"
    actions:
      - "Freeze non-critical deployments"
      - "Focus on reliability improvements"
  - condition: "exhausted"
    actions:
      - "Incident response mode"
      - "All hands on reliability"
SLO дають змогу приймати об'єктивні рішення: впроваджувати нову функцію чи зміцнювати надійність.
Q14: Як провести ефективний post-mortem?
Безвинний post-mortem сприяє навчанню та запобіганню майбутніх інцидентів.
# postmortem-template.yaml
# Blameless post-mortem template

incident:
  id: "INC-2026-0042"
  title: "Payment service unavailability"
  severity: SEV1
  duration: "45 minutes"
  date: "2026-01-15"

# Factual timeline
timeline:
  - time: "14:32"
    event: "Alert: error rate > 5% on payment-api"
    actor: "PagerDuty"
  - time: "14:35"
    event: "Incident declared, team notified"
    actor: "On-call engineer"
  - time: "14:42"
    event: "Cause identified: connection pool exhausted"
    actor: "Backend team"
  - time: "14:55"
    event: "Mitigation: deployment rollback"
    actor: "Backend team"
  - time: "15:17"
    event: "Service restored, monitoring stable"
    actor: "Backend team"

# Measurable impact
impact:
  users_affected: 12500
  transactions_failed: 847
  revenue_impact: "~$16,500"
  slo_budget_consumed: "2.3 days"

# Root cause analysis (5 Whys)
root_cause_analysis:
  - question: "Why was the service unavailable?"
    answer: "DB connections were exhausted"
  - question: "Why were connections exhausted?"
    answer: "A slow query was blocking connections"
  - question: "Why was there a slow query?"
    answer: "Missing index on a new table"
  - question: "Why was the index missing?"
    answer: "Incomplete migration deployed"
  - question: "Why was the migration incomplete?"
    answer: "No execution plan validation in staging"

# Corrective actions
action_items:
  - id: "AI-001"
    type: "prevent"
    description: "Add SQL execution plan validation in CI"
    owner: "DBA team"
    due_date: "2026-01-22"
    priority: P1

  - id: "AI-002"
    type: "detect"
    description: "Alert on connection pool usage > 80%"
    owner: "SRE team"
    due_date: "2026-01-18"
    priority: P1

  - id: "AI-003"
    type: "mitigate"
    description: "Implement circuit breaker on DB queries"
    owner: "Backend team"
    due_date: "2026-01-29"
    priority: P2

# Lessons learned
lessons_learned:
  what_went_well:
    - "Fast detection thanks to alerting (< 3 min)"
    - "Clear communication in incident channel"
    - "Rollback completed in less than 15 minutes"
  what_went_poorly:
    - "No load testing on new endpoint"
    - "Staging didn't reflect prod data volume"
  lucky:
    - "Incident during daytime with full team available"
Мета — покращити систему, а не знайти винного. Дії класифікуються за трьома категоріями: запобігання, виявлення та пом'якшення.
Починай практикувати!
Перевір свої знання з нашими симуляторами співбесід та технічними тестами.
Висновок
Співбесіди на DevOps охоплюють широкий спектр компетенцій — від культури до технічних інструментів. Ключ до успіху — демонструвати глибоке розуміння концепцій, підкріплене конкретними прикладами реалізації.
Чеклист підготовки
- ✅ Знати концепції CI/CD і вміти спроєктувати повний пайплайн
- ✅ Розуміти архітектуру Kubernetes і вміти відлагоджувати типові проблеми
- ✅ Знати IaC-інструменти (Terraform, Ansible) та їхні відповідні сценарії застосування
- ✅ Вміти налаштовувати моніторинг і визначати релевантні алерти
- ✅ Застосовувати найкращі практики безпеки (мінімальні привілеї, ешелонована оборона)
- ✅ Пояснювати SRE-практики (SLO, бюджети помилок, post-mortems)
- ✅ Мати конкретні приклади розв'язання проблем
- ✅ Вміти пояснювати складні концепції простими словами
Теги
Поділитися
Пов'язані статті
ArgoCD та GitOps у 2026 році: безперервне розгортання Kubernetes та питання для співбесід
Поглиблений огляд ArgoCD та GitOps для безперервного розгортання Kubernetes у 2026 році. Application CRDs, sync waves, управління кількома кластерами через ApplicationSets, порівняння ArgoCD та Flux, практичні YAML-приклади та типові питання для технічних співбесід.

Співбесіда з Kubernetes: Pods, Services та Deployments -- повний розбір
Питання на співбесідах про Kubernetes Pods, Services та Deployments -- з прикладами YAML, мережевими механізмами та стратегіями масштабування на 2026 рік.
Kubernetes: розгортання першого застосунку
Практичний посібник із розгортання застосунку в Kubernetes. Від встановлення minikube до Deployments, Services та ConfigMaps з конкретними прикладами.