Perguntas Essenciais para Entrevista de DevOps: Guia Completo 2026
Prepare-se para entrevistas de DevOps com as perguntas mais cobradas sobre CI/CD, Kubernetes, Docker, Terraform e práticas de SRE. Respostas detalhadas inclusas.
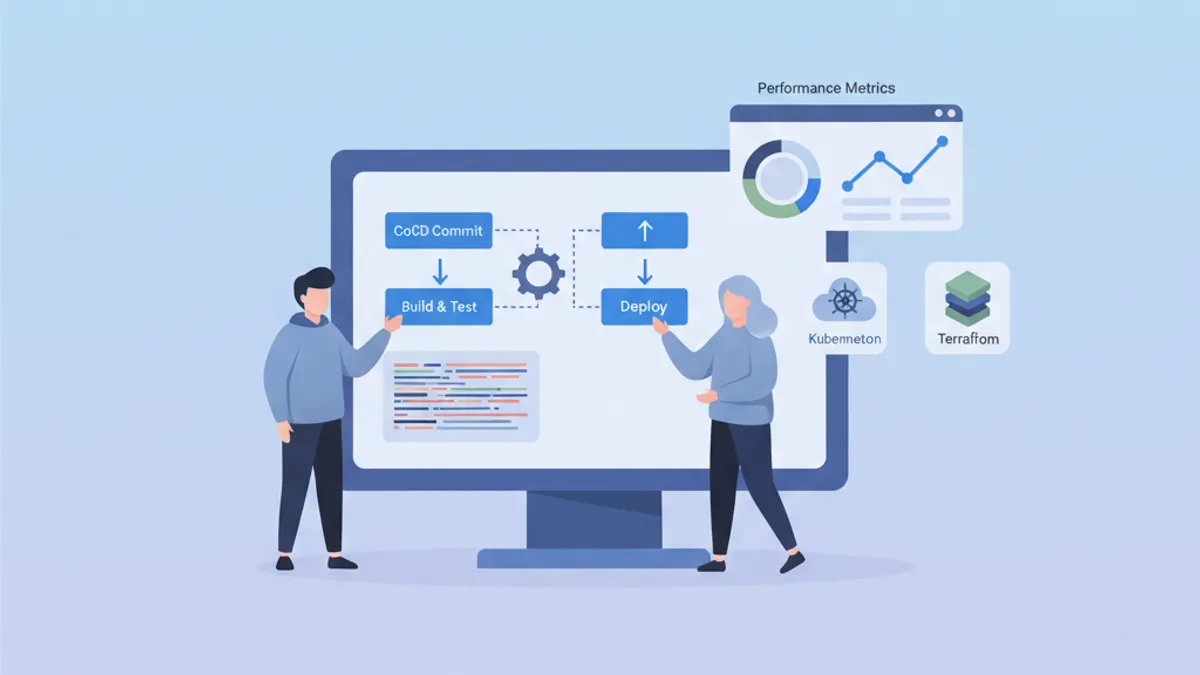
Entrevistas de DevOps avaliam uma combinação singular de habilidades em desenvolvimento, operações e cultura de automação. Este guia reúne as perguntas mais frequentes, organizadas por domínio, com respostas estruturadas que demonstram domínio profundo dos conceitos.
Além do conhecimento técnico, os recrutadores avaliam a capacidade de explicar conceitos complexos de forma simples e compartilhar experiências concretas de resolução de problemas.
Fundamentos e Cultura DevOps
As perguntas iniciais geralmente avaliam a compreensão geral da filosofia DevOps.
Q1: O que é DevOps e quais problemas essa abordagem resolve?
DevOps representa uma cultura e um conjunto de práticas que unificam o desenvolvimento de software (Dev) e as operações de TI (Ops). Essa abordagem tem como objetivo encurtar o ciclo de desenvolvimento mantendo alta qualidade.
# devops-principles.yaml
# The pillars of DevOps culture
principles:
  collaboration:
    description: "Breaking silos between teams"
    practices:
      - "Shared responsibility for production code"
      - "Continuous communication via ChatOps"
      - "Blameless post-mortems"

  automation:
    description: "Automate repetitive tasks"
    practices:
      - "Infrastructure as Code (IaC)"
      - "CI/CD pipelines"
      - "Automated testing at all levels"

  measurement:
    description: "Measure to improve"
    metrics:
      - "Deployment frequency"
      - "Lead time for changes"
      - "Mean time to recovery (MTTR)"
      - "Change failure rate"

  sharing:
    description: "Share knowledge"
    practices:
      - "Documentation as Code"
      - "Automated runbooks"
      - "Regular knowledge sharing sessions"
Os problemas resolvidos incluem deploys lentos e arriscados, falta de visibilidade entre equipes e inconsistência entre ambientes.
Q2: Qual é a diferença entre CI, CD (Continuous Delivery) e CD (Continuous Deployment)?
Esses três conceitos formam uma progressão na automação do ciclo de entrega.
# ci-cd-pipeline-stages.sh
# Illustration of CI/CD stages

# ============================================
# CI (Continuous Integration)
# ============================================
# Goal: Frequently integrate code into a shared repository
# Automation: Build + Tests
echo "CI: Code commit → Build → Unit Tests → Integration Tests"

# ============================================
# CD (Continuous Delivery)
# ============================================
# Goal: Code always deployable to production
# Automation: CI + Staging deployment + Manual approval
echo "CD Delivery: CI → Deploy Staging → Manual Approval → Deploy Prod"

# ============================================
# CD (Continuous Deployment)
# ============================================
# Goal: Automatic deployment to production
# Automation: Entire pipeline without human intervention
echo "CD Deployment: CI → Deploy Staging → Auto Tests → Auto Deploy Prod"
A distinção central está no nível de automação: Continuous Delivery exige validação manual antes da produção, enquanto Continuous Deployment automatiza completamente o processo.
CI/CD e Pipelines
As perguntas sobre CI/CD testam a capacidade de projetar e otimizar pipelines de entrega.
Q3: Como estruturar um pipeline de CI/CD robusto?
Um pipeline bem projetado segue etapas progressivas com pontos de verificação em cada nível.
# .gitlab-ci.yml
# Complete CI/CD pipeline with parallel and sequential stages
stages:
  - validate
  - build
  - test
  - security
  - deploy-staging
  - integration-tests
  - deploy-production

variables:
  DOCKER_IMAGE: $CI_REGISTRY_IMAGE:$CI_COMMIT_SHA

# ============================================
# Stage 1: Fast validation (< 2 min)
# ============================================
lint:
  stage: validate
  script:
    - npm run lint
    - npm run type-check
  # Run on every commit
  rules:
    - if: $CI_PIPELINE_SOURCE == "merge_request_event"
    - if: $CI_COMMIT_BRANCH

# ============================================
# Stage 2: Application build
# ============================================
build:
  stage: build
  script:
    - docker build -t $DOCKER_IMAGE .
    - docker push $DOCKER_IMAGE
  # Cache Docker layers to speed up builds
  cache:
    key: docker-$CI_COMMIT_REF_SLUG
    paths:
      - .docker-cache/

# ============================================
# Stage 3: Parallel tests
# ============================================
unit-tests:
  stage: test
  script:
    - npm run test:unit -- --coverage
  coverage: '/Lines\s*:\s*(\d+\.?\d*)%/'
  artifacts:
    reports:
      coverage_report:
        coverage_format: cobertura
        path: coverage/cobertura-coverage.xml

integration-tests:
  stage: test
  services:
    - postgres:16-alpine
    - redis:7-alpine
  script:
    - npm run test:integration
  # Parallelization with unit tests
  parallel: 3

# ============================================
# Stage 4: Security analysis
# ============================================
sast:
  stage: security
  script:
    - trivy image --exit-code 1 --severity HIGH,CRITICAL $DOCKER_IMAGE
  allow_failure: false

dependency-scan:
  stage: security
  script:
    - npm audit --audit-level=high
  allow_failure: true  # Alert without blocking

# ============================================
# Stage 5: Staging deployment
# ============================================
deploy-staging:
  stage: deploy-staging
  script:
    - kubectl set image deployment/app app=$DOCKER_IMAGE -n staging
    - kubectl rollout status deployment/app -n staging --timeout=300s
  environment:
    name: staging
    url: https://staging.example.com
  only:
    - develop

# ============================================
# Stage 6: E2E tests on staging
# ============================================
e2e-tests:
  stage: integration-tests
  script:
    - npm run test:e2e -- --base-url=https://staging.example.com
  artifacts:
    when: on_failure
    paths:
      - cypress/screenshots/
      - cypress/videos/
  only:
    - develop

# ============================================
# Stage 7: Production deployment
# ============================================
deploy-production:
  stage: deploy-production
  script:
    - kubectl set image deployment/app app=$DOCKER_IMAGE -n production
    - kubectl rollout status deployment/app -n production --timeout=300s
  environment:
    name: production
    url: https://app.example.com
  # Manual deployment with protection
  when: manual
  only:
    - main
Este pipeline ilustra as boas práticas: etapas paralelas para velocidade, artefatos para rastreabilidade e ambientes protegidos para produção.
Q4: Como gerenciar segredos em um pipeline de CI/CD?
O gerenciamento de segredos requer uma abordagem em múltiplas camadas combinando criptografia, rotação e o princípio do menor privilégio.
# kubernetes-secrets-management.yaml
# Approach 1: External Secrets Operator with HashiCorp Vault
apiVersion: external-secrets.io/v1beta1
kind: ExternalSecret
metadata:
  name: app-secrets
  namespace: production
spec:
  refreshInterval: 1h  # Automatic rotation
  secretStoreRef:
    name: vault-backend
    kind: ClusterSecretStore
  target:
    name: app-secrets
    creationPolicy: Owner
  data:
    # Reference to secret in Vault
    - secretKey: DATABASE_PASSWORD
      remoteRef:
        key: secret/data/production/database
        property: password
    - secretKey: API_KEY
      remoteRef:
        key: secret/data/production/api
        property: key
---
# SecretStore configuration
apiVersion: external-secrets.io/v1beta1
kind: ClusterSecretStore
metadata:
  name: vault-backend
spec:
  provider:
    vault:
      server: "https://vault.example.com"
      path: "secret"
      version: "v2"
      auth:
        kubernetes:
          mountPath: "kubernetes"
          role: "external-secrets"
          # Dedicated ServiceAccount with minimal permissions
          serviceAccountRef:
            name: external-secrets-sa
Práticas recomendadas: nunca armazenar segredos em texto simples no código, utilizar gerenciadores dedicados (Vault, AWS Secrets Manager) e habilitar rotação automática.
Evite variáveis de ambiente de CI/CD visíveis nos logs. Sempre mascare segredos com os recursos nativos da plataforma de CI (variáveis mascaradas).
Kubernetes e Orquestração
As perguntas sobre Kubernetes avaliam a compreensão dos conceitos de orquestração e a capacidade de resolver problemas concretos.
Q5: Explique a arquitetura do Kubernetes e o papel de cada componente.
O Kubernetes segue uma arquitetura master-node com componentes de responsabilidades distintas.
# kubernetes-architecture.yaml
# Control Plane components (Master)
control_plane:
  api_server:
    role: "Entry point for all API requests"
    responsibilities:
      - "Validation and configuration of API objects"
      - "Authentication and authorization"
      - "REST interface for kubectl and other clients"

  etcd:
    role: "Distributed key-value database"
    responsibilities:
      - "Cluster state storage"
      - "Source of truth for configuration"
      - "Consensus via Raft algorithm"

  scheduler:
    role: "Assigning Pods to nodes"
    responsibilities:
      - "Evaluating constraints (resources, affinity)"
      - "Selecting the optimal node"
      - "Respecting PodDisruptionBudgets"

  controller_manager:
    role: "Control loops for desired state"
    controllers:
      - "ReplicaSet Controller"
      - "Deployment Controller"
      - "Service Controller"
      - "Node Controller"

# Worker Node components
worker_nodes:
  kubelet:
    role: "Agent on each node"
    responsibilities:
      - "Communication with Control Plane"
      - "Pod lifecycle management"
      - "Node status reporting"

  kube_proxy:
    role: "Network proxy on each node"
    responsibilities:
      - "iptables/IPVS rules for Services"
      - "Intra-cluster load balancing"

  container_runtime:
    role: "Container execution"
    options:
      - "containerd (recommended)"
      - "CRI-O"
Essa arquitetura viabiliza alta disponibilidade: o Control Plane pode ser replicado e as cargas de trabalho são distribuídas entre os Worker Nodes.
Q6: Como depurar um Pod que não inicia?
A depuração no Kubernetes segue uma abordagem metódica analisando diferentes camadas.
# kubernetes-debugging.sh
# Workflow for debugging a failing Pod

# Step 1: Check Pod status
kubectl get pod my-app-pod -o wide
# STATUS: CrashLoopBackOff, ImagePullBackOff, Pending, etc.

# Step 2: Pod details and events
kubectl describe pod my-app-pod
# Important sections:
# - Conditions (PodScheduled, Initialized, Ready)
# - Events (scheduling, pull errors, etc.)

# Step 3: Container logs
kubectl logs my-app-pod --previous  # Previous crash logs
kubectl logs my-app-pod -c init-container  # Init container logs

# Step 4: Interactive execution for debugging
kubectl exec -it my-app-pod -- sh
# Check: env vars, mounted files, network

# Step 5: Check available resources
kubectl describe node <node-name>
# Sections: Allocatable, Allocated resources

# Step 6: Debug with ephemeral Pod (K8s 1.25+)
kubectl debug my-app-pod -it --image=busybox --share-processes
As causas mais comuns incluem: recursos insuficientes, imagem não encontrada, segredos ausentes ou probes mal configuradas.
# pod-debugging-checklist.yaml
# Debugging checklist by status
debugging_by_status:
  Pending:
    causes:
      - "Insufficient resources on nodes"
      - "PersistentVolumeClaim not bound"
      - "Affinity/Taints not satisfied"
    commands:
      - "kubectl describe pod <name> | grep -A 20 Events"
      - "kubectl get pvc"
      - "kubectl describe nodes | grep -A 5 Allocated"

  ImagePullBackOff:
    causes:
      - "Non-existent image or incorrect tag"
      - "Private registry without imagePullSecrets"
      - "Docker Hub rate limiting"
    commands:
      - "kubectl get events --field-selector reason=Failed"
      - "kubectl get secret <pull-secret> -o yaml"

  CrashLoopBackOff:
    causes:
      - "Application error at startup"
      - "Missing configuration (env vars, configmaps)"
      - "Liveness probe too aggressive"
    commands:
      - "kubectl logs <pod> --previous"
      - "kubectl describe pod <pod> | grep -A 10 Liveness"

  OOMKilled:
    causes:
      - "Memory limit too low"
      - "Memory leak in application"
    commands:
      - "kubectl describe pod <pod> | grep -A 5 Last State"
      - "kubectl top pod <pod>"
Pronto para mandar bem nas entrevistas de DevOps?
Pratique com nossos simuladores interativos, flashcards e testes tecnicos.
Infraestrutura como Código
As perguntas sobre IaC avaliam o domínio de ferramentas de provisionamento e boas práticas.
Q7: Terraform vs Ansible: quando usar cada ferramenta?
Essas ferramentas têm filosofias e casos de uso distintos.
# terraform-example.tf
# Terraform: Infrastructure provisioning (declarative)
# Ideal for: cloud resources, networking, infrastructure state

terraform {
  required_providers {
    aws = {
      source  = "hashicorp/aws"
      version = "~> 5.0"
    }
  }
  # Remote state for collaboration
  backend "s3" {
    bucket         = "terraform-state-prod"
    key            = "infrastructure/terraform.tfstate"
    region         = "eu-west-1"
    dynamodb_table = "terraform-locks"
    encrypt        = true
  }
}

# Declarative resource: Terraform manages the lifecycle
resource "aws_eks_cluster" "main" {
  name     = "production-cluster"
  role_arn = aws_iam_role.eks_cluster.arn
  version  = "1.29"

  vpc_config {
    subnet_ids              = module.vpc.private_subnets
    endpoint_private_access = true
    endpoint_public_access  = false
  }

  # Implicit dependencies managed by Terraform
  depends_on = [
    aws_iam_role_policy_attachment.eks_cluster_policy
  ]
}

# Reusable modules for standardization
module "vpc" {
  source  = "terraform-aws-modules/vpc/aws"
  version = "5.0.0"

  name = "production-vpc"
  cidr = "10.0.0.0/16"

  azs             = ["eu-west-1a", "eu-west-1b", "eu-west-1c"]
  private_subnets = ["10.0.1.0/24", "10.0.2.0/24", "10.0.3.0/24"]
  public_subnets  = ["10.0.101.0/24", "10.0.102.0/24", "10.0.103.0/24"]

  enable_nat_gateway = true
  single_nat_gateway = false  # HA: one NAT per AZ
}# ansible-example.yml
# Ansible: Configuration management (procedural/declarative)
# Ideal for: OS configuration, app deployment, orchestration
---
- name: Configure application servers
hosts: app_servers
become: yes
vars:
app_version: "2.5.0"
tasks:
# System package management
- name: Install required packages
ansible.builtin.apt:
name:
- nginx
- python3-pip
- supervisor
state: present
update_cache: yes
# Configuration via Jinja2 templates
- name: Deploy nginx configuration
ansible.builtin.template:
src: templates/nginx.conf.j2
dest: /etc/nginx/sites-available/app
owner: root
group: root
mode: '0644'
notify: Reload nginx
# Application deployment
- name: Deploy application
ansible.builtin.git:
repo: "https://github.com/org/app.git"
dest: /opt/app
version: "v{{ app_version }}"
notify: Restart application
handlers:
- name: Reload nginx
ansible.builtin.service:
name: nginx
state: reloaded
- name: Restart application
ansible.builtin.supervisorctl:
name: app
state: restartedEm síntese: Terraform para infraestrutura (o que existe), Ansible para configuração (como está configurado). As duas ferramentas são frequentemente combinadas em um fluxo completo.
Q8: Como estruturar um projeto Terraform para uma organização de grande porte?
Uma estrutura modular com separação por ambiente facilita a manutenção e a colaboração.
# terraform-project-structure
# Recommended structure for enterprise projects

terraform-infrastructure/
├── modules/                    # Reusable modules
│   ├── networking/
│   │   ├── main.tf
│   │   ├── variables.tf
│   │   ├── outputs.tf
│   │   └── README.md
│   ├── kubernetes/
│   │   ├── main.tf
│   │   ├── variables.tf
│   │   └── outputs.tf
│   └── database/
│       ├── main.tf
│       ├── variables.tf
│       └── outputs.tf
│
├── environments/               # Per-environment configuration
│   ├── dev/
│   │   ├── main.tf            # Calls modules
│   │   ├── variables.tf
│   │   ├── terraform.tfvars   # Dev values
│   │   └── backend.tf         # Dev state
│   ├── staging/
│   │   ├── main.tf
│   │   ├── terraform.tfvars
│   │   └── backend.tf
│   └── production/
│       ├── main.tf
│       ├── terraform.tfvars
│       └── backend.tf
│
├── shared/                     # Shared resources
│   ├── iam/
│   └── dns/
│
└── .github/
    └── workflows/
└── terraform.yml # CI/CD pipeline# environments/production/main.tf
# Example of module usage
module "networking" {
source = "../../modules/networking"
environment = "production"
vpc_cidr = var.vpc_cidr
azs = var.availability_zones
enable_flow_logs = true
}
module "kubernetes" {
source = "../../modules/kubernetes"
environment = "production"
cluster_name = "prod-cluster"
vpc_id = module.networking.vpc_id
subnet_ids = module.networking.private_subnet_ids
node_groups = var.node_groups
# Production: HA configuration
cluster_version = "1.29"
enable_cluster_autoscaler = true
}
module "database" {
source = "../../modules/database"
environment = "production"
vpc_id = module.networking.vpc_id
subnet_ids = module.networking.database_subnet_ids
instance_class = "db.r6g.xlarge"
multi_az = true # HA in production
backup_retention = 30
}Essa estrutura possibilita: versionamento de módulos, revisão de mudanças por ambiente e reaproveitamento de código.
Monitoramento e Observabilidade
As perguntas sobre monitoramento avaliam a capacidade de projetar sistemas observáveis.
Q9: Quais são os três pilares da observabilidade?
A observabilidade se apoia em três tipos de dados complementares que ajudam a entender o estado interno de um sistema.
# observability-pillars.yaml
# The three pillars of observability

pillars:
  metrics:
    description: "Numeric data aggregated over time"
    characteristics:
      - "Low cardinality"
      - "Efficient storage"
      - "Ideal for alerting"
    examples:
      - "request_count (counter)"
      - "response_time_seconds (histogram)"
      - "active_connections (gauge)"
    tools:
      - "Prometheus"
      - "Datadog"
      - "CloudWatch"
    use_cases:
      - "Real-time dashboards"
      - "Threshold alerts"
      - "Capacity planning"

  logs:
    description: "Timestamped text events"
    characteristics:
      - "High cardinality"
      - "Detailed context"
      - "Large storage"
    examples:
      - "Application errors"
      - "Audit events"
      - "Debug information"
    tools:
      - "Loki"
      - "Elasticsearch"
      - "CloudWatch Logs"
    use_cases:
      - "Debugging"
      - "Audit compliance"
      - "Root cause analysis"

  traces:
    description: "Request tracking across services"
    characteristics:
      - "End-to-end view"
      - "Context propagation"
      - "Bottleneck identification"
    examples:
      - "Distributed transaction"
      - "Service dependencies"
      - "Latency breakdown"
    tools:
      - "Jaeger"
      - "Tempo"
      - "AWS X-Ray"
    use_cases:
      - "Performance optimization"
      - "Service dependencies"
      - "Error propagation"
Q10: Como configurar alertas eficazes?
Alertas bem projetados reduzem a fadiga e permitem resposta rápida a incidentes.
# prometheus-alerting-rules.yaml
# Prometheus alerting rules with best practices

groups:
  - name: application-alerts
    rules:
      # Alert on symptom, not cause
      - alert: HighErrorRate
        # Error rate > 1% over 5 minutes
        expr: |
          sum(rate(http_requests_total{status=~"5.."}[5m]))
          /
          sum(rate(http_requests_total[5m]))
          > 0.01
        for: 5m  # Avoid false positives
        labels:
          severity: critical
          team: backend
        annotations:
          summary: "High error rate detected"
          description: |
            Error rate is {{ $value | humanizePercentage }}
            for the last 5 minutes.
          runbook_url: "https://wiki.example.com/runbooks/high-error-rate"

      # Proactive alert on saturation
      - alert: DiskSpaceRunningLow
        expr: |
          (node_filesystem_avail_bytes / node_filesystem_size_bytes)
          * 100 < 20
        for: 15m
        labels:
          severity: warning
        annotations:
          summary: "Disk space below 20%"
          description: |
            Node {{ $labels.instance }} has only
            {{ $value | humanize }}% disk space remaining.

      # SLO-based alerting
      - alert: SLOBudgetBurnRate
        # Error budget consumed too quickly
        expr: |
          (
            sum(rate(http_requests_total{status=~"5.."}[1h]))
            /
            sum(rate(http_requests_total[1h]))
          ) > (1 - 0.999) * 14.4
        for: 5m
        labels:
          severity: critical
        annotations:
          summary: "SLO budget burning too fast"
          description: |
            At current error rate, monthly SLO budget will be
exhausted in less than 2 days.# alertmanager-config.yaml
# AlertManager configuration with intelligent routing
global:
resolve_timeout: 5m
route:
receiver: default
group_by: [alertname, cluster, service]
group_wait: 30s # Wait to group alerts
group_interval: 5m # Interval between grouped notifications
repeat_interval: 4h # Re-alert if not resolved
routes:
# Critical alerts: immediate notification
- match:
severity: critical
receiver: pagerduty-critical
continue: true # Also notify Slack
# Alerts by team
- match:
team: backend
receiver: slack-backend
- match:
team: infrastructure
receiver: slack-infra
receivers:
- name: pagerduty-critical
pagerduty_configs:
- service_key: <pagerduty-key>
severity: critical
- name: slack-backend
slack_configs:
- channel: '#alerts-backend'
send_resolved: true
title: '{{ .Status | toUpper }}: {{ .CommonAnnotations.summary }}'
text: '{{ .CommonAnnotations.description }}'Princípios fundamentais: alertar sobre sintomas (impacto para o usuário) e não sobre causas, incluir runbooks e ajustar os limiares de acordo com os SLOs.
Segurança e Conformidade
As perguntas sobre segurança avaliam a compreensão dos riscos e das contramedidas.
Q11: Como proteger um cluster Kubernetes?
A segurança no Kubernetes abrange múltiplas camadas: rede, autenticação, cargas de trabalho e dados.
# kubernetes-security-policies.yaml
# NetworkPolicy: network isolation between namespaces

apiVersion: networking.k8s.io/v1
kind: NetworkPolicy
metadata:
  name: default-deny-all
  namespace: production
spec:
  # Applied to all pods in namespace
  podSelector: {}
  policyTypes:
    - Ingress
    - Egress
  # No traffic allowed by default
  ingress: []
  egress: []
---
# Allow only necessary traffic
apiVersion: networking.k8s.io/v1
kind: NetworkPolicy
metadata:
  name: api-network-policy
  namespace: production
spec:
  podSelector:
    matchLabels:
      app: api
  policyTypes:
    - Ingress
    - Egress
  ingress:
    # Accept only from ingress controller
    - from:
        - namespaceSelector:
            matchLabels:
              name: ingress-nginx
      ports:
        - protocol: TCP
          port: 8080
  egress:
    # Allow to database
    - to:
        - podSelector:
            matchLabels:
              app: postgres
      ports:
        - protocol: TCP
          port: 5432
    # Allow DNS
    - to:
        - namespaceSelector: {}
          podSelector:
            matchLabels:
              k8s-app: kube-dns
      ports:
        - protocol: UDP
port: 53# pod-security-standards.yaml
# PodSecurity: workload restrictions
apiVersion: v1
kind: Namespace
metadata:
name: production
labels:
# Enforce: blocks violations
pod-security.kubernetes.io/enforce: restricted
# Warn: warns without blocking
pod-security.kubernetes.io/warn: restricted
# Audit: logs violations
pod-security.kubernetes.io/audit: restricted
---
# Pod compliant with "restricted" standards
apiVersion: v1
kind: Pod
metadata:
name: secure-pod
namespace: production
spec:
securityContext:
runAsNonRoot: true
runAsUser: 1000
fsGroup: 1000
seccompProfile:
type: RuntimeDefault
containers:
- name: app
image: myapp:latest
securityContext:
allowPrivilegeEscalation: false
readOnlyRootFilesystem: true
capabilities:
drop:
- ALL
resources:
limits:
memory: "256Mi"
cpu: "500m"
requests:
memory: "128Mi"
cpu: "250m"
volumeMounts:
- name: tmp
mountPath: /tmp
volumes:
- name: tmp
emptyDir: {}A segurança no Kubernetes combina múltiplas camadas: RBAC para autorização, NetworkPolicies para isolamento de rede, PodSecurity para restrições de carga de trabalho e criptografia de segredos em repouso.
Q12: O que é o princípio do menor privilégio e como aplicá-lo?
Este princípio determina que um usuário ou sistema deve ter apenas as permissões mínimas necessárias para executar sua tarefa.
# rbac-least-privilege.yaml
# Kubernetes RBAC with minimal permissions

# Role: permissions in a specific namespace
apiVersion: rbac.authorization.k8s.io/v1
kind: Role
metadata:
  namespace: production
  name: deployment-manager
rules:
  # Pod reading (for monitoring)
  - apiGroups: [""]
    resources: ["pods", "pods/log"]
    verbs: ["get", "list", "watch"]
  # Deployment management only
  - apiGroups: ["apps"]
    resources: ["deployments"]
    verbs: ["get", "list", "watch", "update", "patch"]
  # No create/delete on deployments
  # No access to secrets or sensitive configmaps
---
# RoleBinding: Role <-> ServiceAccount association
apiVersion: rbac.authorization.k8s.io/v1
kind: RoleBinding
metadata:
  name: deployment-manager-binding
  namespace: production
subjects:
  - kind: ServiceAccount
    name: ci-cd-deployer
    namespace: production
roleRef:
  kind: Role
  name: deployment-manager
  apiGroup: rbac.authorization.k8s.io
---
# Dedicated ServiceAccount for CI/CD
apiVersion: v1
kind: ServiceAccount
metadata:
  name: ci-cd-deployer
  namespace: production
  annotations:
    # Automatic token expiration
    kubernetes.io/enforce-mountable-secrets: "true"
Este princípio se aplica também ao AWS IAM, bancos de dados e acessos de rede.
SRE e Confiabilidade
As perguntas sobre SRE avaliam a compreensão das práticas de confiabilidade e gestão de incidentes.
Q13: O que é um SLO e como defini-lo?
Os Service Level Objectives (SLOs) quantificam a confiabilidade esperada de um serviço e orientam decisões de engenharia.
# slo-definitions.yaml
# SLO definitions for an API service

service: payment-api
owner: payments-team

slos:
  - name: availability
    description: "Service responds successfully to requests"
    sli:
      # SLI: measured metric
      type: availability
      good_events: "http_requests_total{status=~'2..'}"
      total_events: "http_requests_total"
    target: 99.9%  # SLO: objective
    window: 30d    # Measurement window
    # Error budget: 0.1% = 43.2 minutes/month
    error_budget:
      monthly_minutes: 43.2

  - name: latency
    description: "Response time below threshold"
    sli:
      type: latency
      good_events: "http_request_duration_seconds_bucket{le='0.3'}"
      total_events: "http_request_duration_seconds_count"
    target: 99%  # 99% of requests < 300ms
    window: 30d

  - name: throughput
    description: "Ability to process transactions"
    sli:
      type: throughput
      query: "sum(rate(transactions_processed_total[5m]))"
    target: ">= 1000 TPS"

# Actions based on error budget
error_budget_policy:
  - condition: "remaining > 50%"
    actions:
      - "Feature development prioritized"
      - "Experimentation allowed"
  - condition: "remaining 20-50%"
    actions:
      - "Balance features and reliability"
      - "Increase testing coverage"
  - condition: "remaining < 20%"
    actions:
      - "Freeze non-critical deployments"
      - "Focus on reliability improvements"
  - condition: "exhausted"
    actions:
      - "Incident response mode"
      - "All hands on reliability"
Os SLOs permitem decisões objetivas: lançar uma nova funcionalidade ou reforçar a confiabilidade do serviço.
Q14: Como conduzir um post-mortem eficaz?
Um post-mortem sem atribuição de culpa promove o aprendizado e a prevenção de incidentes futuros.
# postmortem-template.yaml
# Blameless post-mortem template

incident:
  id: "INC-2026-0042"
  title: "Payment service unavailability"
  severity: SEV1
  duration: "45 minutes"
  date: "2026-01-15"

# Factual timeline
timeline:
  - time: "14:32"
    event: "Alert: error rate > 5% on payment-api"
    actor: "PagerDuty"
  - time: "14:35"
    event: "Incident declared, team notified"
    actor: "On-call engineer"
  - time: "14:42"
    event: "Cause identified: connection pool exhausted"
    actor: "Backend team"
  - time: "14:55"
    event: "Mitigation: deployment rollback"
    actor: "Backend team"
  - time: "15:17"
    event: "Service restored, monitoring stable"
    actor: "Backend team"

# Measurable impact
impact:
  users_affected: 12500
  transactions_failed: 847
  revenue_impact: "~$16,500"
  slo_budget_consumed: "2.3 days"

# Root cause analysis (5 Whys)
root_cause_analysis:
  - question: "Why was the service unavailable?"
    answer: "DB connections were exhausted"
  - question: "Why were connections exhausted?"
    answer: "A slow query was blocking connections"
  - question: "Why was there a slow query?"
    answer: "Missing index on a new table"
  - question: "Why was the index missing?"
    answer: "Incomplete migration deployed"
  - question: "Why was the migration incomplete?"
    answer: "No execution plan validation in staging"

# Corrective actions
action_items:
  - id: "AI-001"
    type: "prevent"
    description: "Add SQL execution plan validation in CI"
    owner: "DBA team"
    due_date: "2026-01-22"
    priority: P1

  - id: "AI-002"
    type: "detect"
    description: "Alert on connection pool usage > 80%"
    owner: "SRE team"
    due_date: "2026-01-18"
    priority: P1

  - id: "AI-003"
    type: "mitigate"
    description: "Implement circuit breaker on DB queries"
    owner: "Backend team"
    due_date: "2026-01-29"
    priority: P2

# Lessons learned
lessons_learned:
  what_went_well:
    - "Fast detection thanks to alerting (< 3 min)"
    - "Clear communication in incident channel"
    - "Rollback completed in less than 15 minutes"
  what_went_poorly:
    - "No load testing on new endpoint"
    - "Staging didn't reflect prod data volume"
  lucky:
    - "Incident during daytime with full team available"
O objetivo é aprimorar o sistema, não encontrar um culpado. As ações são classificadas em três categorias: prevenção, detecção e mitigação.
Comece a praticar!
Teste seus conhecimentos com nossos simuladores de entrevista e testes tecnicos.
Conclusão
As entrevistas de DevOps cobrem um amplo espectro de habilidades, da cultura às ferramentas técnicas. O caminho para o sucesso está em demonstrar compreensão profunda dos conceitos, ilustrada por exemplos concretos de implementação.
Checklist de preparação
- ✅ Dominar os conceitos de CI/CD e ser capaz de projetar um pipeline completo
- ✅ Compreender a arquitetura do Kubernetes e saber depurar problemas comuns
- ✅ Conhecer as ferramentas de IaC (Terraform, Ansible) e seus casos de uso específicos
- ✅ Saber configurar monitoramento e definir alertas relevantes
- ✅ Aplicar boas práticas de segurança (menor privilégio, defesa em profundidade)
- ✅ Explicar práticas de SRE (SLOs, error budgets, post-mortems)
- ✅ Ter exemplos concretos de resolução de problemas
- ✅ Ser capaz de explicar conceitos complexos de forma simples
Tags
Compartilhar
Artigos relacionados
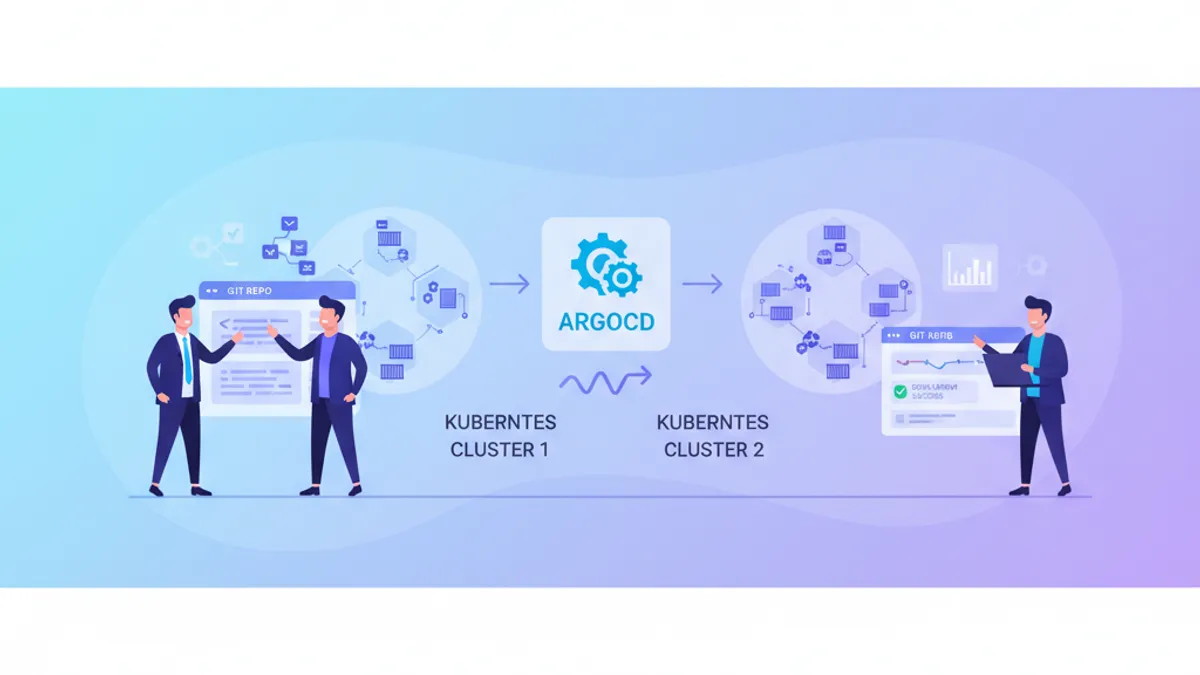
ArgoCD e GitOps em 2026: Deploy Contínuo no Kubernetes e Perguntas de Entrevista
Guia completo sobre ArgoCD e GitOps para deploy contínuo em Kubernetes em 2026. Aborda Application CRDs, sync waves, gerenciamento multi-cluster com ApplicationSets, comparação ArgoCD vs Flux e perguntas frequentes de entrevista para DevOps.
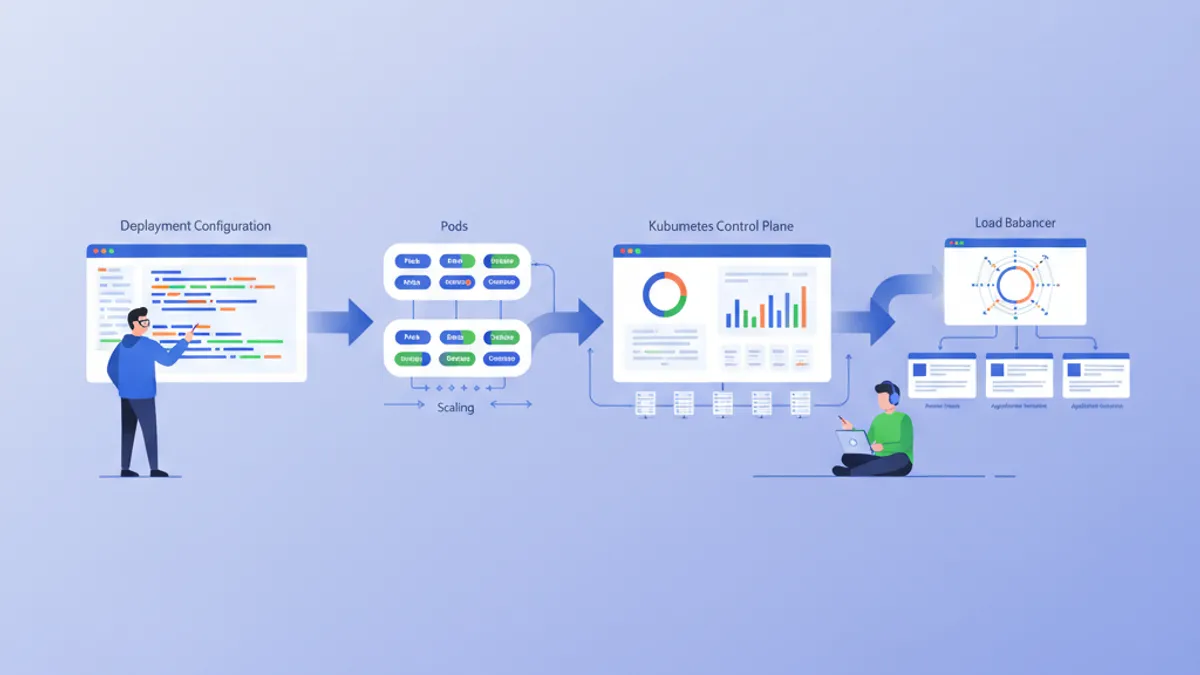
Kubernetes: Implantando sua primeira aplicação
Guia prático para implantar uma aplicação no Kubernetes. Da instalação do minikube até Deployments, Services e ConfigMaps com exemplos concretos.
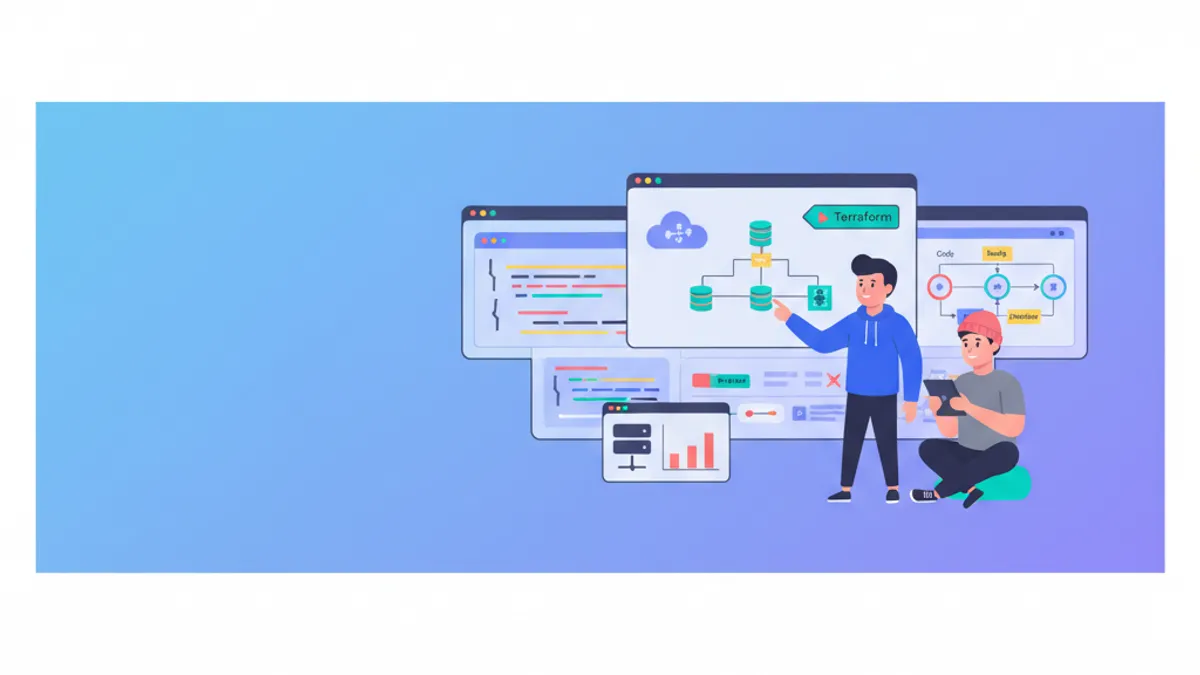
Perguntas de entrevista sobre Terraform: guia completo de Infrastructure as Code 2026
Domine as perguntas de entrevista sobre Terraform cobrindo gerenciamento de state, modulos, workspaces, providers e boas praticas IaC. Atualizado para Terraform 1.14 e HCP Terraform em 2026.