Spring Boot Actuator: Productie-Monitoring met Micrometer en Prometheus
Volledige Spring Boot Actuator gids voor productie-monitoring. Micrometer-configuratie, Prometheus-metrieken, custom endpoints en alerting.
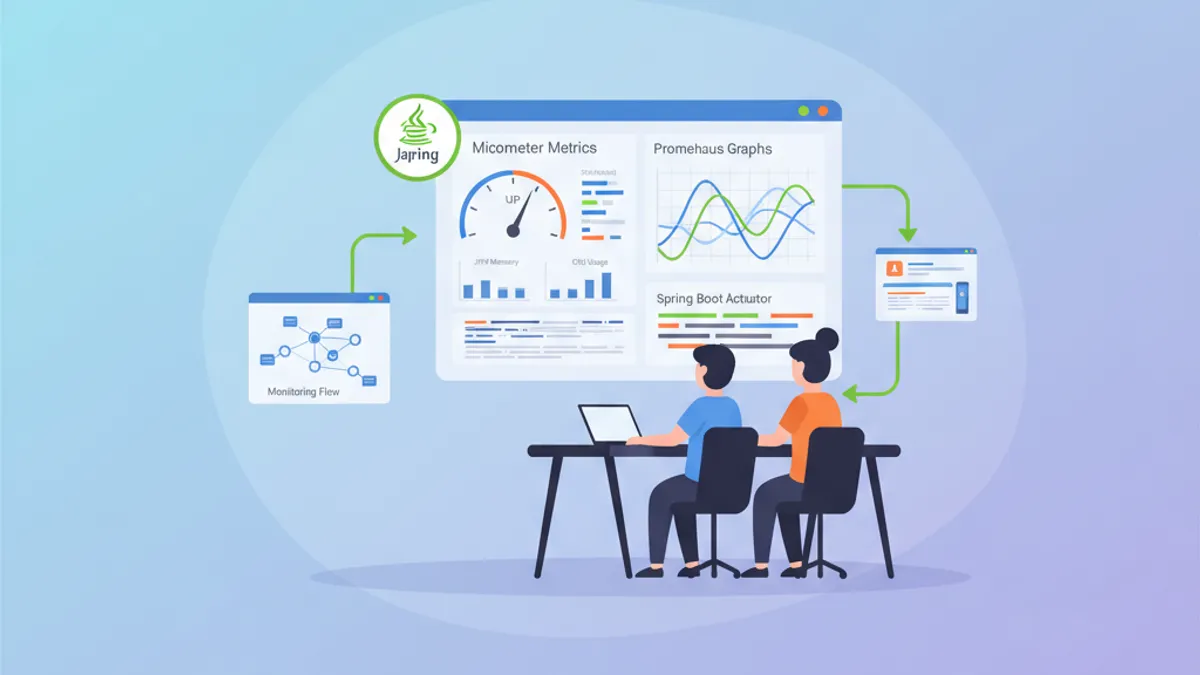
Spring Boot Actuator transformeert het monitoren van Java-applicaties door productieklare endpoints aan te bieden voor health checks, metrieken en diagnostiek. In combinatie met Micrometer en Prometheus levert het een complete observability-oplossing voor productieomgevingen.
Actuator stelt automatisch meer dan 50 JVM- en applicatiemetrieken beschikbaar zonder extra configuratie. Micrometer fungeert als facade om deze metrieken te publiceren naar Prometheus, Grafana, Datadog of een ander monitoringsysteem.
Basisconfiguratie met Spring Boot 3
Vereiste Maven-Dependencies
De integratie van Actuator met Prometheus vereist drie hoofd-dependencies. De Actuator-starter activeert de endpoints, Micrometer levert de metriek-abstractie en de Prometheus-registry formatteert de data voor scraping.
<!-- pom.xml -->
<!-- Actuator + Micrometer + Prometheus Configuration -->
<dependencies>
    <!-- Spring Boot Actuator - monitoring endpoints -->
    <dependency>
        <groupId>org.springframework.boot</groupId>
        <artifactId>spring-boot-starter-actuator</artifactId>
    </dependency>

    <!-- Micrometer Registry Prometheus -->
    <!-- Exposes metrics in Prometheus format -->
    <dependency>
        <groupId>io.micrometer</groupId>
        <artifactId>micrometer-registry-prometheus</artifactId>
    </dependency>

    <!-- AOP for @Timed and @Counted metrics -->
    <dependency>
        <groupId>org.springframework.boot</groupId>
        <artifactId>spring-boot-starter-aop</artifactId>
    </dependency>
</dependencies>
Deze dependencies zijn voldoende om een /actuator/prometheus-endpoint beschikbaar te stellen dat Prometheus periodiek bevraagt.
Configuratie van Actuator-Endpoints
Standaard zijn alleen de endpoints health en info via HTTP toegankelijk. Een expliciete configuratie bepaalt welke endpoints in productie bereikbaar blijven.
# application.yml
# Actuator configuration for production
management:
  endpoints:
    web:
      exposure:
        # Endpoints exposed over HTTP
        # health, info, prometheus are minimum for monitoring
        include: health,info,prometheus,metrics,env,loggers
      base-path: /actuator
    # Disable unused endpoints to reduce attack surface
    enabled-by-default: false
  endpoint:
    # Enable each required endpoint individually
    health:
      enabled: true
      show-details: when-authorized
      show-components: when-authorized
    info:
      enabled: true
    prometheus:
      enabled: true
    metrics:
      enabled: true
    env:
      enabled: true
      # Mask sensitive values
      show-values: when-authorized
    loggers:
      enabled: true
De optie show-details: when-authorized toont health-details enkel aan geauthenticeerde gebruikers met de juiste rol.
// Securing Actuator endpoints
package com.example.monitoring.config;

import org.springframework.boot.actuate.autoconfigure.security.servlet.EndpointRequest;
import org.springframework.context.annotation.Bean;
import org.springframework.context.annotation.Configuration;
import org.springframework.security.config.annotation.web.builders.HttpSecurity;
import org.springframework.security.web.SecurityFilterChain;

@Configuration
public class ActuatorSecurityConfig {

    @Bean
    SecurityFilterChain actuatorSecurityFilterChain(HttpSecurity http) throws Exception {
        return http
            .securityMatcher(EndpointRequest.toAnyEndpoint())
            .authorizeHttpRequests(auth -> auth
                // Health and info public for load balancers
                .requestMatchers(EndpointRequest.to("health", "info")).permitAll()
                // Prometheus accessible from internal network
                .requestMatchers(EndpointRequest.to("prometheus")).hasIpAddress("10.0.0.0/8")
                // Other endpoints restricted to admins
                .anyRequest().hasRole("ACTUATOR_ADMIN")
            )
            .httpBasic(basic -> {})
            .build();
    }
}
Deze configuratie geeft publieke toegang tot de basis-endpoints en beschermt tegelijk de gevoeligere.
Custom Metrieken met Micrometer
Applicatie-Counters en -Gauges
Micrometer biedt verschillende metriektypes die passen bij uiteenlopende use cases. Counters meten cumulatieve gebeurtenissen, gauges meten momentwaarden en timers meten de duur van een operatie.
// Custom business metrics service
package com.example.monitoring.metrics;

import io.micrometer.core.instrument.Counter;
import io.micrometer.core.instrument.Gauge;
import io.micrometer.core.instrument.MeterRegistry;
import io.micrometer.core.instrument.Timer;
import org.springframework.stereotype.Service;

import java.util.concurrent.atomic.AtomicInteger;
import java.util.function.Supplier;

@Service
public class OrderMetricsService {

    // Counter for orders created with status tag
    private final Counter ordersCreatedCounter;
    // Timer to measure processing duration
    private final Timer orderProcessingTimer;
    // Atomic value for pending orders gauge
    private final AtomicInteger pendingOrdersCount = new AtomicInteger(0);

    public OrderMetricsService(MeterRegistry registry) {
        // Counter with tags for filtering in Prometheus
        this.ordersCreatedCounter = Counter.builder("orders.created.total")
            .description("Total number of orders created")
            .tag("application", "order-service")
            .register(registry);

        // Timer with histogram for percentiles
        this.orderProcessingTimer = Timer.builder("orders.processing.duration")
            .description("Order processing duration")
            .publishPercentiles(0.5, 0.95, 0.99)
            .publishPercentileHistogram()
            .register(registry);

        // Gauge linked to atomic value
        // Updates automatically on each scrape
        Gauge.builder("orders.pending.count", pendingOrdersCount, AtomicInteger::get)
            .description("Number of orders pending processing")
            .register(registry);
    }

    public void recordOrderCreated() {
        ordersCreatedCounter.increment();
        pendingOrdersCount.incrementAndGet();
    }

    public void recordOrderProcessed(Runnable processingLogic) {
        // Automatically measures execution duration
        orderProcessingTimer.record(processingLogic);
        pendingOrdersCount.decrementAndGet();
    }

    public <T> T recordOrderProcessedWithResult(Supplier<T> processingLogic) {
        return orderProcessingTimer.record(processingLogic);
    }
}
Het gebruik van tags maakt het mogelijk om metrieken in Prometheus te filteren en te aggregeren met nauwkeurige PromQL-queries.
Annotaties @Timed en @Counted
Om boilerplate-code te vermijden, biedt Micrometer AOP-annotaties die methoden automatisch instrumenteren.
// Automatic instrumentation with annotations
package com.example.monitoring.service;

import io.micrometer.core.annotation.Counted;
import io.micrometer.core.annotation.Timed;
import org.springframework.stereotype.Service;

@Service
public class PaymentService {

    // @Timed automatically creates a Timer
    // Measures each call and publishes count, sum, max
    @Timed(
        value = "payment.process.duration",
        description = "Payment processing duration",
        percentiles = {0.5, 0.95, 0.99},
        histogram = true
    )
    public PaymentResult processPayment(PaymentRequest request) {
        // Payment logic
        validatePayment(request);
        return executePayment(request);
    }

    // @Counted increments a counter on each call
    // Useful for discrete events
    @Counted(
        value = "payment.refunds.total",
        description = "Total number of refunds"
    )
    public void refundPayment(String transactionId) {
        // Refund logic
    }

    // Combining both annotations
    @Timed(value = "payment.validation.duration")
    @Counted(value = "payment.validation.total")
    private void validatePayment(PaymentRequest request) {
        // Payment validation
    }
}// Required configuration to enable @Timed
package com.example.monitoring.config;
import io.micrometer.core.aop.CountedAspect;
import io.micrometer.core.aop.TimedAspect;
import io.micrometer.core.instrument.MeterRegistry;
import org.springframework.context.annotation.Bean;
import org.springframework.context.annotation.Configuration;
@Configuration
public class TimedAspectConfig {
// Aspect required for @Timed to work
@Bean
TimedAspect timedAspect(MeterRegistry registry) {
return new TimedAspect(registry);
}
// Aspect for @Counted
@Bean
CountedAspect countedAspect(MeterRegistry registry) {
return new CountedAspect(registry);
}
}De annotaties @Timed en @Counted werken uitsluitend op Spring-beans en externe aanroepen. Interne aanroepen binnen dezelfde klasse omzeilen de AOP-proxy en worden niet geïnstrumenteerd.
Klaar om je Spring Boot gesprekken te halen?
Oefen met onze interactieve simulatoren, flashcards en technische tests.
Custom Health-Endpoints
Business Health Indicators
Health Indicators controleren de toestand van externe afhankelijkheden en kritieke business-componenten. Spring Boot levert standaard indicators voor databases, Redis en andere veelvoorkomende services.
// Health indicator for payment gateway
package com.example.monitoring.health;

import org.springframework.boot.actuate.health.Health;
import org.springframework.boot.actuate.health.HealthIndicator;
import org.springframework.stereotype.Component;
import org.springframework.web.client.RestClient;

import java.time.Duration;
import java.time.Instant;

@Component
public class PaymentGatewayHealthIndicator implements HealthIndicator {

    private final RestClient restClient;
    private final String gatewayHealthUrl;

    public PaymentGatewayHealthIndicator(RestClient.Builder restClientBuilder) {
        this.restClient = restClientBuilder.build();
        this.gatewayHealthUrl = "https://api.payment-gateway.com/health";
    }

    @Override
    public Health health() {
        Instant start = Instant.now();

        try {
            // Call gateway health endpoint
            var response = restClient.get()
                .uri(gatewayHealthUrl)
                .retrieve()
                .toBodilessEntity();

            Duration responseTime = Duration.between(start, Instant.now());

            if (response.getStatusCode().is2xxSuccessful()) {
                return Health.up()
                    .withDetail("responseTime", responseTime.toMillis() + "ms")
                    .withDetail("statusCode", response.getStatusCode().value())
                    .build();
            } else {
                return Health.down()
                    .withDetail("statusCode", response.getStatusCode().value())
                    .withDetail("reason", "Unexpected status code")
                    .build();
            }
        } catch (Exception e) {
            Duration responseTime = Duration.between(start, Instant.now());

            return Health.down()
                .withDetail("error", e.getClass().getSimpleName())
                .withDetail("message", e.getMessage())
                .withDetail("responseTime", responseTime.toMillis() + "ms")
                .build();
        }
    }
}
Deze indicator verschijnt automatisch in /actuator/health onder de naam paymentGateway.
Health-Groepen voor Kubernetes
Health-groepen maken het mogelijk om aparte endpoints aan te maken voor de liveness- en readiness-probes van Kubernetes.
# application.yml
# Health groups configuration for Kubernetes
management:
  endpoint:
    health:
      group:
        # Liveness probe - is the application alive?
        liveness:
          include: livenessState
          show-details: always
        # Readiness probe - can the application receive traffic?
        readiness:
          include: readinessState,db,redis,paymentGateway
          show-details: always
        # Custom probe for critical dependencies
        critical:
          include: db,paymentGateway
          show-details: when-authorized
  health:
    # Enable Kubernetes states
    livenessstate:
      enabled: true
    readinessstate:
enabled: true// Programmatic health groups configuration
package com.example.monitoring.config;
import org.springframework.boot.actuate.availability.LivenessStateHealthIndicator;
import org.springframework.boot.actuate.availability.ReadinessStateHealthIndicator;
import org.springframework.boot.availability.ApplicationAvailability;
import org.springframework.context.annotation.Bean;
import org.springframework.context.annotation.Configuration;
@Configuration
public class KubernetesHealthConfig {
@Bean
LivenessStateHealthIndicator livenessStateHealthIndicator(
ApplicationAvailability availability) {
return new LivenessStateHealthIndicator(availability);
}
@Bean
ReadinessStateHealthIndicator readinessStateHealthIndicator(
ApplicationAvailability availability) {
return new ReadinessStateHealthIndicator(availability);
}
}De Kubernetes-probes verwijzen vervolgens naar dedicated endpoints:
# kubernetes-deployment.yml
# Kubernetes probes configuration
spec:
  containers:
    - name: order-service
      livenessProbe:
        httpGet:
          path: /actuator/health/liveness
          port: 8080
        initialDelaySeconds: 30
        periodSeconds: 10
        failureThreshold: 3
      readinessProbe:
        httpGet:
          path: /actuator/health/readiness
          port: 8080
        initialDelaySeconds: 10
        periodSeconds: 5
        failureThreshold: 3
Integratie met Prometheus en Grafana
Prometheus-Scrapingconfiguratie
Prometheus verzamelt metrieken door periodiek het endpoint /actuator/prometheus te bevragen. De configuratie definieert de scrapingdoelen.
# prometheus.yml
# Prometheus configuration for Spring Boot
global:
  scrape_interval: 15s
  evaluation_interval: 15s

scrape_configs:
  - job_name: 'spring-boot-apps'
    metrics_path: '/actuator/prometheus'
    scrape_interval: 10s
    static_configs:
      - targets:
          - 'order-service:8080'
          - 'payment-service:8080'
          - 'inventory-service:8080'
    # Relabeling to add metadata
    relabel_configs:
      - source_labels: [__address__]
        target_label: instance
        regex: '([^:]+):\d+'
        replacement: '${1}'

  # Kubernetes service discovery
  - job_name: 'kubernetes-pods'
    kubernetes_sd_configs:
      - role: pod
    relabel_configs:
      # Only scrape pods with annotation
      - source_labels: [__meta_kubernetes_pod_annotation_prometheus_io_scrape]
        action: keep
        regex: true
      - source_labels: [__meta_kubernetes_pod_annotation_prometheus_io_path]
        action: replace
        target_label: __metrics_path__
        regex: (.+)
Standaard JVM-Metrieken
Actuator met Micrometer levert automatisch gedetailleerde JVM-metrieken. De belangrijkste voor monitoring staan hieronder.
# PromQL queries for JVM monitoring

# Heap memory usage
jvm_memory_used_bytes{area="heap"}

# Memory usage percentage
jvm_memory_used_bytes{area="heap"} / jvm_memory_max_bytes{area="heap"} * 100

# Active threads
jvm_threads_live_threads

# Garbage collection - time spent
rate(jvm_gc_pause_seconds_sum[5m])

# GC count per minute
rate(jvm_gc_pause_seconds_count[1m]) * 60

# CPU used by JVM
process_cpu_usage

# Active database connections
hikaricp_connections_active

# Connection pool utilization
hikaricp_connections_active / hikaricp_connections_max * 100// Additional JVM metrics
package com.example.monitoring.metrics;
import io.micrometer.core.instrument.Gauge;
import io.micrometer.core.instrument.MeterRegistry;
import io.micrometer.core.instrument.binder.MeterBinder;
import org.springframework.stereotype.Component;
import java.lang.management.ManagementFactory;
import java.lang.management.OperatingSystemMXBean;
@Component
public class CustomJvmMetrics implements MeterBinder {
@Override
public void bindTo(MeterRegistry registry) {
OperatingSystemMXBean osBean = ManagementFactory.getOperatingSystemMXBean();
// System load average
Gauge.builder("system.load.average", osBean, OperatingSystemMXBean::getSystemLoadAverage)
.description("System load average over 1 minute")
.register(registry);
// Available processors count
Gauge.builder("system.cpu.count", osBean, OperatingSystemMXBean::getAvailableProcessors)
.description("Number of available processors")
.register(registry);
// Application uptime
Gauge.builder("application.uptime.seconds",
ManagementFactory.getRuntimeMXBean(),
bean -> bean.getUptime() / 1000.0)
.description("Application uptime in seconds")
.register(registry);
}
}Kant-en-Klare Grafana-Dashboards
Grafana biedt voorgeconfigureerde dashboards voor Spring Boot. Dashboard-ID 12900 levert een volledig overzicht van de Actuator-metrieken.
{
  "annotations": {
    "list": []
  },
  "panels": [
    {
      "title": "Request Rate",
      "type": "graph",
      "targets": [
        {
          "expr": "rate(http_server_requests_seconds_count{application=\"$application\"}[5m])",
          "legendFormat": "{{method}} {{uri}} - {{status}}"
        }
      ]
    },
    {
      "title": "Response Time P99",
      "type": "graph",
      "targets": [
        {
          "expr": "histogram_quantile(0.99, rate(http_server_requests_seconds_bucket{application=\"$application\"}[5m]))",
          "legendFormat": "{{method}} {{uri}}"
        }
      ]
    },
    {
      "title": "Error Rate",
      "type": "singlestat",
      "targets": [
        {
          "expr": "sum(rate(http_server_requests_seconds_count{application=\"$application\",status=~\"5..\"}[5m])) / sum(rate(http_server_requests_seconds_count{application=\"$application\"}[5m])) * 100"
        }
      ]
    }
  ]
}Een dashboard importeren: Grafana → Dashboards → Import → ID 12900 (Spring Boot Statistics) of 4701 (JVM Micrometer). Deze dashboards werken direct met de standaard Actuator-metrieken.
Alerting met Prometheus
Essentiële Alertregels
De alertregels van Prometheus genereren meldingen zodra metrieken kritieke drempels overschrijden.
# alerting-rules.yml
# Alert rules for Spring Boot applications
groups:
  - name: spring-boot-alerts
    rules:
      # Alert if application is down
      - alert: ApplicationDown
        expr: up{job="spring-boot-apps"} == 0
        for: 1m
        labels:
          severity: critical
        annotations:
          summary: "Application {{ $labels.instance }} is down"
          description: "{{ $labels.instance }} has been down for more than 1 minute"

      # Alert on HTTP error rate
      - alert: HighErrorRate
        expr: |
          sum(rate(http_server_requests_seconds_count{status=~"5.."}[5m])) by (application)
          /
          sum(rate(http_server_requests_seconds_count[5m])) by (application)
          > 0.05
        for: 5m
        labels:
          severity: warning
        annotations:
          summary: "High error rate on {{ $labels.application }}"
          description: "Error rate is {{ $value | humanizePercentage }}"

      # Alert on P99 latency
      - alert: HighLatency
        expr: |
          histogram_quantile(0.99,
            rate(http_server_requests_seconds_bucket[5m])
          ) > 2
        for: 5m
        labels:
          severity: warning
        annotations:
          summary: "High latency detected"
          description: "P99 latency is {{ $value | humanizeDuration }}"

      # Heap memory alert
      - alert: HighHeapUsage
        expr: |
          jvm_memory_used_bytes{area="heap"}
          / jvm_memory_max_bytes{area="heap"}
          > 0.85
        for: 5m
        labels:
          severity: warning
        annotations:
          summary: "High heap memory usage on {{ $labels.instance }}"
          description: "Heap usage is at {{ $value | humanizePercentage }}"

      # Database connection pool exhausted alert
      - alert: DatabaseConnectionPoolExhausted
        expr: |
          hikaricp_connections_active
          / hikaricp_connections_max
          > 0.9
        for: 2m
        labels:
          severity: critical
        annotations:
          summary: "Database connection pool nearly exhausted"
          description: "{{ $value | humanizePercentage }} of connections in use"

      # Excessive GC alert
      - alert: HighGCPause
        expr: |
          rate(jvm_gc_pause_seconds_sum[5m])
          / rate(jvm_gc_pause_seconds_count[5m])
          > 0.5
        for: 5m
        labels:
          severity: warning
        annotations:
          summary: "High GC pause time"
          description: "Average GC pause is {{ $value | humanizeDuration }}"
Deze alerts dekken de meest voorkomende productieproblemen af: beschikbaarheid, prestaties en resources.
HTTP- en Database-Metrieken
Automatische Instrumentatie van HTTP-Requests
Spring Boot 3 instrumenteert automatisch alle binnenkomende HTTP-requests met gedetailleerde metrieken.
# application.yml
# HTTP metrics configuration
management:
  metrics:
    distribution:
      # Enable histograms for percentiles
      percentiles-histogram:
        http.server.requests: true
      percentiles:
        http.server.requests: 0.5, 0.75, 0.95, 0.99
      # Define SLA buckets
      slo:
        http.server.requests: 100ms, 500ms, 1s, 2s
    tags:
      # Global tags added to all metrics
      application: ${spring.application.name}
environment: ${spring.profiles.active:default}// HTTP tags customization
package com.example.monitoring.config;
import io.micrometer.core.instrument.Tag;
import org.springframework.boot.actuate.metrics.web.servlet.WebMvcTagsContributor;
import org.springframework.context.annotation.Bean;
import org.springframework.context.annotation.Configuration;
import org.springframework.web.servlet.HandlerMapping;
import jakarta.servlet.http.HttpServletRequest;
import jakarta.servlet.http.HttpServletResponse;
import java.util.Collections;
@Configuration
public class WebMvcMetricsConfig {
@Bean
WebMvcTagsContributor customTagsContributor() {
return (request, response, handler, exception) -> {
// Add custom tags to HTTP metrics
String userId = request.getHeader("X-User-Id");
String tenantId = request.getHeader("X-Tenant-Id");
return java.util.List.of(
Tag.of("user.type", userId != null ? "authenticated" : "anonymous"),
Tag.of("tenant", tenantId != null ? tenantId : "default")
);
};
}
}HikariCP- en SQL-Querymetrieken
De metrieken van de HikariCP-connectiepool worden automatisch beschikbaar gesteld. Voor SQL-queries activeert een aanvullende configuratie de tracing van de duur ervan.
# application.yml
# HikariCP configuration with metrics
spring:
  datasource:
    hikari:
      pool-name: OrderServicePool
      maximum-pool-size: 20
      minimum-idle: 5
      connection-timeout: 30000
      idle-timeout: 600000
      max-lifetime: 1800000
      # Enable detailed metrics
register-mbeans: true// Additional metrics for SQL queries
package com.example.monitoring.config;
import io.micrometer.core.instrument.MeterRegistry;
import net.ttddyy.dsproxy.listener.logging.SLF4JLogLevel;
import net.ttddyy.dsproxy.support.ProxyDataSourceBuilder;
import org.springframework.beans.factory.annotation.Qualifier;
import org.springframework.boot.autoconfigure.jdbc.DataSourceProperties;
import org.springframework.context.annotation.Bean;
import org.springframework.context.annotation.Configuration;
import org.springframework.context.annotation.Primary;
import javax.sql.DataSource;
@Configuration
public class DataSourceMetricsConfig {
@Bean
@Primary
DataSource metricsDataSource(
DataSourceProperties properties,
MeterRegistry registry) {
// Original DataSource
DataSource originalDataSource = properties
.initializeDataSourceBuilder()
.build();
// Proxy with metrics
return ProxyDataSourceBuilder.create(originalDataSource)
.name("order-service-db")
.listener(new MicrometerQueryMetricsListener(registry))
.logQueryBySlf4j(SLF4JLogLevel.DEBUG)
.build();
}
}// Listener for SQL query metrics
package com.example.monitoring.metrics;
import io.micrometer.core.instrument.MeterRegistry;
import io.micrometer.core.instrument.Timer;
import net.ttddyy.dsproxy.ExecutionInfo;
import net.ttddyy.dsproxy.QueryInfo;
import net.ttddyy.dsproxy.listener.QueryExecutionListener;
import java.util.List;
import java.util.concurrent.TimeUnit;
public class MicrometerQueryMetricsListener implements QueryExecutionListener {
private final Timer queryTimer;
public MicrometerQueryMetricsListener(MeterRegistry registry) {
this.queryTimer = Timer.builder("sql.query.duration")
.description("SQL query execution duration")
.publishPercentiles(0.5, 0.95, 0.99)
.register(registry);
}
@Override
public void beforeQuery(ExecutionInfo execInfo, List<QueryInfo> queryInfoList) {
// Before execution
}
@Override
public void afterQuery(ExecutionInfo execInfo, List<QueryInfo> queryInfoList) {
// Record duration for each query
long elapsedTime = execInfo.getElapsedTime();
queryTimer.record(elapsedTime, TimeUnit.MILLISECONDS);
}
}Best Practices voor Productie
Cardinaliteit van Metrieken
Een te hoge cardinaliteit verslechtert de prestaties van Prometheus. Elke unieke combinatie van tags creëert een aparte tijdreeks.
// ❌ AVOID - Explosive cardinality
package com.example.monitoring.antipattern;

@Service
public class AntiPatternHighCardinality {

    private final MeterRegistry registry;

    // ❌ BAD: userId creates one series per user
    public void trackUserAction(String userId, String action) {
        Counter.builder("user.actions")
            .tag("userId", userId)  // Millions of possible values!
            .tag("action", action)
            .register(registry)
            .increment();
    }
}// ✅ Controlled cardinality
package com.example.monitoring.bestpractice;
@Service
public class GoodPracticeCardinality {
private final MeterRegistry registry;
// ✅ GOOD: User category instead of ID
public void trackUserAction(User user, String action) {
Counter.builder("user.actions")
.tag("userType", user.getSubscriptionType()) // FREE, PREMIUM, ENTERPRISE
.tag("action", action)
.register(registry)
.increment();
}
// ✅ GOOD: Grouping by range
public void trackResponseTime(long responseTimeMs) {
String bucket = categorizeResponseTime(responseTimeMs);
Counter.builder("response.time.bucket")
.tag("bucket", bucket) // fast, normal, slow, very_slow
.register(registry)
.increment();
}
private String categorizeResponseTime(long ms) {
if (ms < 100) return "fast";
if (ms < 500) return "normal";
if (ms < 2000) return "slow";
return "very_slow";
}
}Productieklare Configuratie
# application-production.yml
# Optimized configuration for production
management:
  endpoints:
    web:
      exposure:
        include: health,info,prometheus
  endpoint:
    health:
      show-details: when-authorized
      probes:
        enabled: true
  metrics:
    export:
      prometheus:
        enabled: true
        step: 30s
    distribution:
      percentiles-histogram:
        http.server.requests: true
      minimum-expected-value:
        http.server.requests: 1ms
      maximum-expected-value:
        http.server.requests: 30s
    tags:
      application: ${spring.application.name}
      environment: production
      version: ${app.version:unknown}
  server:
    # Separate port for management endpoints
    port: 9090

# Disable non-essential endpoints in production
  endpoint:
    env:
      enabled: false
    beans:
      enabled: false
    configprops:
      enabled: false
    mappings:
      enabled: false
Conclusie
Spring Boot Actuator gecombineerd met Micrometer en Prometheus levert een complete monitoringoplossing:
✅ Minimale configuratie - productieklare endpoints met Spring Boot Starter
✅ Automatische JVM-metrieken - geheugen, threads, GC, CPU zonder extra code
✅ Custom metrieken - Counter, Gauge, Timer met @Timed/@Counted-annotaties
✅ Health Indicators - controle van externe afhankelijkheden en Kubernetes-statussen
✅ Prometheus-integratie - standaardformaat voor scraping en alerting
✅ Ingebouwde beveiliging - toegangscontrole op gevoelige endpoints
✅ Grafana-dashboards - directe visualisatie met voorgeconfigureerde dashboards
✅ Alerting - PromQL-regels om afwijkingen in productie te detecteren
Deze observability-stack vormt de essentiële basis om Spring Boot applicaties met vertrouwen in productie te draaien.
Begin met oefenen!
Test je kennis met onze gespreksimulatoren en technische tests.
Tags
Delen
Gerelateerde artikelen

Spring Boot logging in 2026: gestructureerde logs in productie met Logback en JSON
Volledige gids voor gestructureerde logging in Spring Boot. Logback JSON-configuratie, MDC voor tracing, best practices in productie en integratie met ELK Stack.

Spring Kafka: event-driven architectuur met resiliënte consumers
Volledige Spring Kafka-gids voor event-driven architecturen. Configuratie, resiliënte consumers, retry-strategieën, dead letter queues en productiepatronen voor gedistribueerde applicaties.
Spring GraphQL Sollicitatiegesprek: Resolvers, DataLoaders en Oplossingen voor het N+1-probleem
Voorbereiding op Spring GraphQL sollicitatiegesprekken met deze complete gids. Resolvers, DataLoaders, omgaan met het N+1-probleem, mutaties en best practices voor technische vragen.