Temel DevOps Mülakat Soruları: Kapsamlı Rehber 2026
CI/CD, Kubernetes, Docker, Terraform ve SRE uygulamaları üzerine bilmeniz gereken DevOps mülakat sorularıyla hazırlıklı olun. Ayrıntılı yanıtlar dahil.
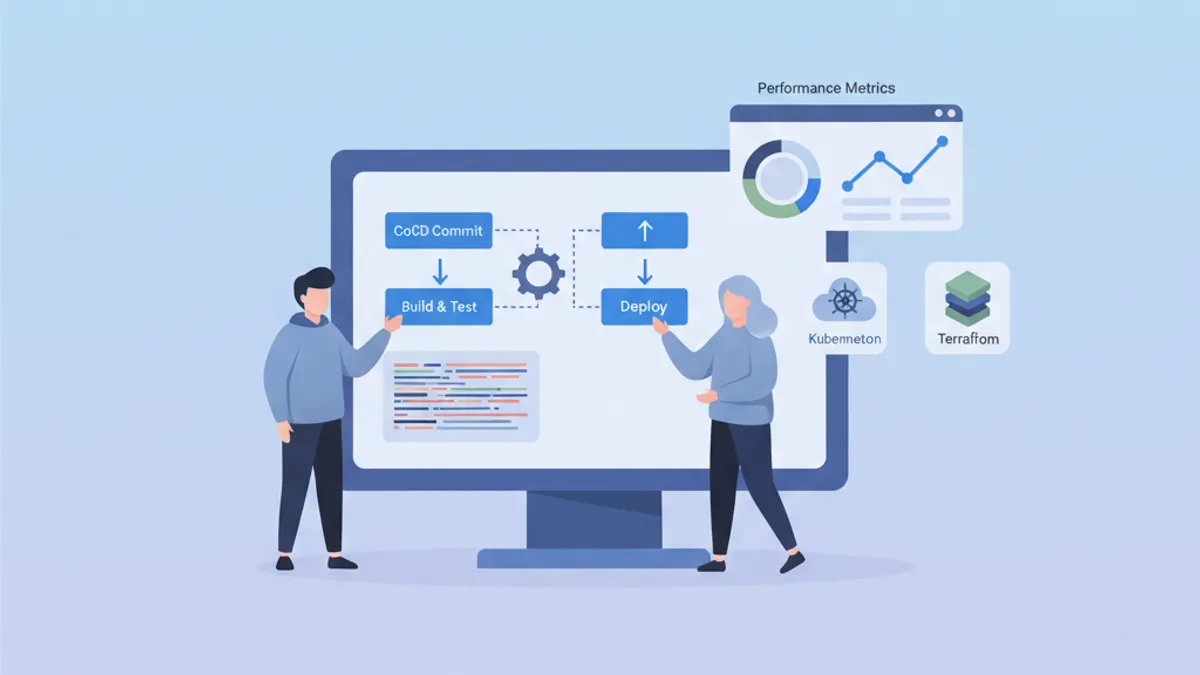
DevOps mülakatları, geliştirme, operasyon ve otomasyon kültürünü bir arada değerlendiren özgün bir beceri kombinasyonunu ölçer. Bu rehber, alanlara göre gruplandırılmış ve kavramların derin hakimiyetini ortaya koyan yapılandırılmış yanıtlarla birlikte en sık sorulan soruları derlemektedir.
Teknik bilginin ötesinde, işverenler karmaşık kavramları sade bir dille açıklayabilme ve somut problem çözme deneyimlerini aktarabilme kapasitesini değerlendirir.
DevOps Temelleri ve Kültür
İlk sorular çoğunlukla DevOps felsefesinin bütünsel olarak anlaşılıp anlaşılmadığını ölçer.
S1: DevOps nedir ve bu yaklaşım hangi sorunları çözer?
DevOps, yazılım geliştirme (Dev) ile BT operasyonlarını (Ops) birleştiren bir kültür ve uygulamalar bütününü temsil eder. Bu yaklaşım, yüksek kaliteyi korurken geliştirme döngüsünü kısaltmayı hedefler.
# devops-principles.yaml
# The pillars of DevOps culture
principles:
  collaboration:
    description: "Breaking silos between teams"
    practices:
      - "Shared responsibility for production code"
      - "Continuous communication via ChatOps"
      - "Blameless post-mortems"

  automation:
    description: "Automate repetitive tasks"
    practices:
      - "Infrastructure as Code (IaC)"
      - "CI/CD pipelines"
      - "Automated testing at all levels"

  measurement:
    description: "Measure to improve"
    metrics:
      - "Deployment frequency"
      - "Lead time for changes"
      - "Mean time to recovery (MTTR)"
      - "Change failure rate"

  sharing:
    description: "Share knowledge"
    practices:
      - "Documentation as Code"
      - "Automated runbooks"
      - "Regular knowledge sharing sessions"
Çözülen sorunlar arasında yavaş ve riskli dağıtımlar, ekipler arası görünürlük eksikliği ve ortamlar arasındaki tutarsızlıklar yer alır.
S2: CI, CD (Sürekli Teslimat) ve CD (Sürekli Dağıtım) arasındaki fark nedir?
Bu üç kavram, teslimat döngüsü otomasyonunda birbirini izleyen bir ilerlemeyi oluşturur.
# ci-cd-pipeline-stages.sh
# Illustration of CI/CD stages

# ============================================
# CI (Continuous Integration)
# ============================================
# Goal: Frequently integrate code into a shared repository
# Automation: Build + Tests
echo "CI: Code commit → Build → Unit Tests → Integration Tests"

# ============================================
# CD (Continuous Delivery)
# ============================================
# Goal: Code always deployable to production
# Automation: CI + Staging deployment + Manual approval
echo "CD Delivery: CI → Deploy Staging → Manual Approval → Deploy Prod"

# ============================================
# CD (Continuous Deployment)
# ============================================
# Goal: Automatic deployment to production
# Automation: Entire pipeline without human intervention
echo "CD Deployment: CI → Deploy Staging → Auto Tests → Auto Deploy Prod"
Temel ayrım otomasyon düzeyinde yatar: Sürekli Teslimat üretim öncesinde manuel onay gerektirirken, Sürekli Dağıtım tüm süreci insan müdahalesi olmadan otomatize eder.
CI/CD ve Pipeline'lar
CI/CD soruları, teslimat pipeline'larını tasarlama ve optimize etme kapasitesini sınar.
S3: Sağlam bir CI/CD pipeline'ı nasıl yapılandırılır?
İyi tasarlanmış bir pipeline, her seviyede kontrol noktaları bulunan aşamalı aşamaları takip eder.
# .gitlab-ci.yml
# Complete CI/CD pipeline with parallel and sequential stages
stages:
  - validate
  - build
  - test
  - security
  - deploy-staging
  - integration-tests
  - deploy-production

variables:
  DOCKER_IMAGE: $CI_REGISTRY_IMAGE:$CI_COMMIT_SHA

# ============================================
# Stage 1: Fast validation (< 2 min)
# ============================================
lint:
  stage: validate
  script:
    - npm run lint
    - npm run type-check
  # Run on every commit
  rules:
    - if: $CI_PIPELINE_SOURCE == "merge_request_event"
    - if: $CI_COMMIT_BRANCH

# ============================================
# Stage 2: Application build
# ============================================
build:
  stage: build
  script:
    - docker build -t $DOCKER_IMAGE .
    - docker push $DOCKER_IMAGE
  # Cache Docker layers to speed up builds
  cache:
    key: docker-$CI_COMMIT_REF_SLUG
    paths:
      - .docker-cache/

# ============================================
# Stage 3: Parallel tests
# ============================================
unit-tests:
  stage: test
  script:
    - npm run test:unit -- --coverage
  coverage: '/Lines\s*:\s*(\d+\.?\d*)%/'
  artifacts:
    reports:
      coverage_report:
        coverage_format: cobertura
        path: coverage/cobertura-coverage.xml

integration-tests:
  stage: test
  services:
    - postgres:16-alpine
    - redis:7-alpine
  script:
    - npm run test:integration
  # Parallelization with unit tests
  parallel: 3

# ============================================
# Stage 4: Security analysis
# ============================================
sast:
  stage: security
  script:
    - trivy image --exit-code 1 --severity HIGH,CRITICAL $DOCKER_IMAGE
  allow_failure: false

dependency-scan:
  stage: security
  script:
    - npm audit --audit-level=high
  allow_failure: true  # Alert without blocking

# ============================================
# Stage 5: Staging deployment
# ============================================
deploy-staging:
  stage: deploy-staging
  script:
    - kubectl set image deployment/app app=$DOCKER_IMAGE -n staging
    - kubectl rollout status deployment/app -n staging --timeout=300s
  environment:
    name: staging
    url: https://staging.example.com
  only:
    - develop

# ============================================
# Stage 6: E2E tests on staging
# ============================================
e2e-tests:
  stage: integration-tests
  script:
    - npm run test:e2e -- --base-url=https://staging.example.com
  artifacts:
    when: on_failure
    paths:
      - cypress/screenshots/
      - cypress/videos/
  only:
    - develop

# ============================================
# Stage 7: Production deployment
# ============================================
deploy-production:
  stage: deploy-production
  script:
    - kubectl set image deployment/app app=$DOCKER_IMAGE -n production
    - kubectl rollout status deployment/app -n production --timeout=300s
  environment:
    name: production
    url: https://app.example.com
  # Manuel dağıtım ve koruma
  when: manual
  only:
    - main
Bu pipeline, en iyi uygulamaları örneklemektedir: hız için paralel aşamalar, izlenebilirlik için artifact'lar ve üretim için korumalı ortamlar.
S4: CI/CD pipeline'ında gizli anahtarlar nasıl yönetilir?
Gizli anahtar yönetimi, şifreleme, rotasyon ve en az ayrıcalık ilkesini birleştiren çok katmanlı bir yaklaşım gerektirir.
# kubernetes-secrets-management.yaml
# Approach 1: External Secrets Operator with HashiCorp Vault
apiVersion: external-secrets.io/v1beta1
kind: ExternalSecret
metadata:
  name: app-secrets
  namespace: production
spec:
  refreshInterval: 1h  # Automatic rotation
  secretStoreRef:
    name: vault-backend
    kind: ClusterSecretStore
  target:
    name: app-secrets
    creationPolicy: Owner
  data:
    # Reference to secret in Vault
    - secretKey: DATABASE_PASSWORD
      remoteRef:
        key: secret/data/production/database
        property: password
    - secretKey: API_KEY
      remoteRef:
        key: secret/data/production/api
        property: key
---
# SecretStore configuration
apiVersion: external-secrets.io/v1beta1
kind: ClusterSecretStore
metadata:
  name: vault-backend
spec:
  provider:
    vault:
      server: "https://vault.example.com"
      path: "secret"
      version: "v2"
      auth:
        kubernetes:
          mountPath: "kubernetes"
          role: "external-secrets"
          # Dedicated ServiceAccount with minimal permissions
          serviceAccountRef:
            name: external-secrets-sa
Önerilen uygulamalar şunlardır: gizli anahtarları düz metin olarak kodda asla saklamayın, özel gizli anahtar yöneticileri (Vault, AWS Secrets Manager) kullanın ve otomatik rotasyonu etkinleştirin.
Loglarda görünür olan CI/CD ortam değişkenlerinden kaçının. Gizli anahtarları her zaman CI platformunun yerel özellikleriyle (masked variables) maskeleyin.
Kubernetes ve Orkestrasyon
Kubernetes soruları, orkestrasyon kavramlarının anlaşılmasını ve somut sorunları çözme kapasitesini değerlendirir.
S5: Kubernetes mimarisini ve her bileşenin rolünü açıklayın.
Kubernetes, belirgin sorumlulukları olan bileşenlerle birlikte master-node mimarisini izler.
# kubernetes-architecture.yaml
# Control Plane components (Master)
control_plane:
  api_server:
    role: "Entry point for all API requests"
    responsibilities:
      - "Validation and configuration of API objects"
      - "Authentication and authorization"
      - "REST interface for kubectl and other clients"

  etcd:
    role: "Distributed key-value database"
    responsibilities:
      - "Cluster state storage"
      - "Source of truth for configuration"
      - "Consensus via Raft algorithm"

  scheduler:
    role: "Assigning Pods to nodes"
    responsibilities:
      - "Evaluating constraints (resources, affinity)"
      - "Selecting the optimal node"
      - "Respecting PodDisruptionBudgets"

  controller_manager:
    role: "Control loops for desired state"
    controllers:
      - "ReplicaSet Controller"
      - "Deployment Controller"
      - "Service Controller"
      - "Node Controller"

# Worker Node components
worker_nodes:
  kubelet:
    role: "Agent on each node"
    responsibilities:
      - "Communication with Control Plane"
      - "Pod lifecycle management"
      - "Node status reporting"

  kube_proxy:
    role: "Network proxy on each node"
    responsibilities:
      - "iptables/IPVS rules for Services"
      - "Intra-cluster load balancing"

  container_runtime:
    role: "Container execution"
    options:
      - "containerd (recommended)"
      - "CRI-O"
Bu mimari yüksek kullanılabilirliği sağlar: Control Plane replike edilebilir ve iş yükleri Worker Node'lar arasında dağıtılır.
S6: Başlamayan bir Pod nasıl debug edilir?
Kubernetes debug süreci, farklı katmanları analiz ederek metodolojik bir yaklaşımı izler.
# kubernetes-debugging.sh
# Workflow for debugging a failing Pod

# Step 1: Check Pod status
kubectl get pod my-app-pod -o wide
# STATUS: CrashLoopBackOff, ImagePullBackOff, Pending, etc.

# Step 2: Pod details and events
kubectl describe pod my-app-pod
# Important sections:
# - Conditions (PodScheduled, Initialized, Ready)
# - Events (scheduling, pull errors, etc.)

# Step 3: Container logs
kubectl logs my-app-pod --previous  # Previous crash logs
kubectl logs my-app-pod -c init-container  # Init container logs

# Step 4: Interactive execution for debugging
kubectl exec -it my-app-pod -- sh
# Check: env vars, mounted files, network

# Step 5: Check available resources
kubectl describe node <node-name>
# Sections: Allocatable, Allocated resources

# Step 6: Debug with ephemeral Pod (K8s 1.25+)
kubectl debug my-app-pod -it --image=busybox --share-processes
Yaygın nedenler arasında yetersiz kaynaklar, bulunamayan image, eksik secret'lar veya yanlış yapılandırılmış probe'lar yer alır.
# pod-debugging-checklist.yaml
# Debugging checklist by status
debugging_by_status:
  Pending:
    causes:
      - "Insufficient resources on nodes"
      - "PersistentVolumeClaim not bound"
      - "Affinity/Taints not satisfied"
    commands:
      - "kubectl describe pod <name> | grep -A 20 Events"
      - "kubectl get pvc"
      - "kubectl describe nodes | grep -A 5 Allocated"

  ImagePullBackOff:
    causes:
      - "Non-existent image or incorrect tag"
      - "Private registry without imagePullSecrets"
      - "Docker Hub rate limiting"
    commands:
      - "kubectl get events --field-selector reason=Failed"
      - "kubectl get secret <pull-secret> -o yaml"

  CrashLoopBackOff:
    causes:
      - "Application error at startup"
      - "Missing configuration (env vars, configmaps)"
      - "Liveness probe too aggressive"
    commands:
      - "kubectl logs <pod> --previous"
      - "kubectl describe pod <pod> | grep -A 10 Liveness"

  OOMKilled:
    causes:
      - "Memory limit too low"
      - "Memory leak in application"
    commands:
      - "kubectl describe pod <pod> | grep -A 5 Last State"
      - "kubectl top pod <pod>"
DevOps mülakatlarında başarılı olmaya hazır mısın?
İnteraktif simülatörler, flashcards ve teknik testlerle pratik yap.
Kod Olarak Altyapı
IaC soruları, provizyon araçlarının hakimiyetini ve en iyi uygulamaları değerlendirir.
S7: Terraform mu Ansible mi: her araç ne zaman kullanılır?
Bu araçların birbirinden farklı felsefeleri ve kullanım alanları bulunur.
# terraform-example.tf
# Terraform: Infrastructure provisioning (declarative)
# Ideal for: cloud resources, networking, infrastructure state

terraform {
  required_providers {
    aws = {
      source  = "hashicorp/aws"
      version = "~> 5.0"
    }
  }
  # Remote state for collaboration
  backend "s3" {
    bucket         = "terraform-state-prod"
    key            = "infrastructure/terraform.tfstate"
    region         = "eu-west-1"
    dynamodb_table = "terraform-locks"
    encrypt        = true
  }
}

# Declarative resource: Terraform manages the lifecycle
resource "aws_eks_cluster" "main" {
  name     = "production-cluster"
  role_arn = aws_iam_role.eks_cluster.arn
  version  = "1.29"

  vpc_config {
    subnet_ids              = module.vpc.private_subnets
    endpoint_private_access = true
    endpoint_public_access  = false
  }

  # Implicit dependencies managed by Terraform
  depends_on = [
    aws_iam_role_policy_attachment.eks_cluster_policy
  ]
}

# Reusable modules for standardization
module "vpc" {
  source  = "terraform-aws-modules/vpc/aws"
  version = "5.0.0"

  name = "production-vpc"
  cidr = "10.0.0.0/16"

  azs             = ["eu-west-1a", "eu-west-1b", "eu-west-1c"]
  private_subnets = ["10.0.1.0/24", "10.0.2.0/24", "10.0.3.0/24"]
  public_subnets  = ["10.0.101.0/24", "10.0.102.0/24", "10.0.103.0/24"]

  enable_nat_gateway = true
  single_nat_gateway = false  # HA: one NAT per AZ
}# ansible-example.yml
# Ansible: Configuration management (procedural/declarative)
# Ideal for: OS configuration, app deployment, orchestration
---
- name: Configure application servers
hosts: app_servers
become: yes
vars:
app_version: "2.5.0"
tasks:
# System package management
- name: Install required packages
ansible.builtin.apt:
name:
- nginx
- python3-pip
- supervisor
state: present
update_cache: yes
# Configuration via Jinja2 templates
- name: Deploy nginx configuration
ansible.builtin.template:
src: templates/nginx.conf.j2
dest: /etc/nginx/sites-available/app
owner: root
group: root
mode: '0644'
notify: Reload nginx
# Application deployment
- name: Deploy application
ansible.builtin.git:
repo: "https://github.com/org/app.git"
dest: /opt/app
version: "v{{ app_version }}"
notify: Restart application
handlers:
- name: Reload nginx
ansible.builtin.service:
name: nginx
state: reloaded
- name: Restart application
ansible.builtin.supervisorctl:
name: app
state: restartedÖzetle: Terraform altyapı için (neyin var olduğu), Ansible yapılandırma için (nasıl yapılandırıldığı). Her iki araç da eksiksiz bir iş akışında sıklıkla birlikte kullanılır.
S8: Büyük bir organizasyon için Terraform projesi nasıl yapılandırılır?
Ortam ayrımı olan modüler bir yapı, bakımı ve işbirliğini kolaylaştırır.
# terraform-project-structure
# Recommended structure for enterprise projects

terraform-infrastructure/
├── modules/                    # Reusable modules
│   ├── networking/
│   │   ├── main.tf
│   │   ├── variables.tf
│   │   ├── outputs.tf
│   │   └── README.md
│   ├── kubernetes/
│   │   ├── main.tf
│   │   ├── variables.tf
│   │   └── outputs.tf
│   └── database/
│       ├── main.tf
│       ├── variables.tf
│       └── outputs.tf
│
├── environments/               # Per-environment configuration
│   ├── dev/
│   │   ├── main.tf            # Calls modules
│   │   ├── variables.tf
│   │   ├── terraform.tfvars   # Dev values
│   │   └── backend.tf         # Dev state
│   ├── staging/
│   │   ├── main.tf
│   │   ├── terraform.tfvars
│   │   └── backend.tf
│   └── production/
│       ├── main.tf
│       ├── terraform.tfvars
│       └── backend.tf
│
├── shared/                     # Shared resources
│   ├── iam/
│   └── dns/
│
└── .github/
    └── workflows/
└── terraform.yml # CI/CD pipeline# environments/production/main.tf
# Example of module usage
module "networking" {
source = "../../modules/networking"
environment = "production"
vpc_cidr = var.vpc_cidr
azs = var.availability_zones
enable_flow_logs = true
}
module "kubernetes" {
source = "../../modules/kubernetes"
environment = "production"
cluster_name = "prod-cluster"
vpc_id = module.networking.vpc_id
subnet_ids = module.networking.private_subnet_ids
node_groups = var.node_groups
# Production: HA configuration
cluster_version = "1.29"
enable_cluster_autoscaler = true
}
module "database" {
source = "../../modules/database"
environment = "production"
vpc_id = module.networking.vpc_id
subnet_ids = module.networking.database_subnet_ids
instance_class = "db.r6g.xlarge"
multi_az = true # HA in production
backup_retention = 30
}Bu yapı şunları mümkün kılar: modül versiyonlaması, ortam bazında değişiklik incelemesi ve kod yeniden kullanımı.
İzleme ve Gözlemlenebilirlik
İzleme soruları, gözlemlenebilir sistemler tasarlama kapasitesini değerlendirir.
S9: Gözlemlenebilirliğin üç temel direği nedir?
Gözlemlenebilirlik, bir sistemin iç durumunu anlamaya yardımcı olan üç tamamlayıcı veri türüne dayanır.
# observability-pillars.yaml
# The three pillars of observability

pillars:
  metrics:
    description: "Numeric data aggregated over time"
    characteristics:
      - "Low cardinality"
      - "Efficient storage"
      - "Ideal for alerting"
    examples:
      - "request_count (counter)"
      - "response_time_seconds (histogram)"
      - "active_connections (gauge)"
    tools:
      - "Prometheus"
      - "Datadog"
      - "CloudWatch"
    use_cases:
      - "Real-time dashboards"
      - "Threshold alerts"
      - "Capacity planning"

  logs:
    description: "Timestamped text events"
    characteristics:
      - "High cardinality"
      - "Detailed context"
      - "Large storage"
    examples:
      - "Application errors"
      - "Audit events"
      - "Debug information"
    tools:
      - "Loki"
      - "Elasticsearch"
      - "CloudWatch Logs"
    use_cases:
      - "Debugging"
      - "Audit compliance"
      - "Root cause analysis"

  traces:
    description: "Request tracking across services"
    characteristics:
      - "End-to-end view"
      - "Context propagation"
      - "Bottleneck identification"
    examples:
      - "Distributed transaction"
      - "Service dependencies"
      - "Latency breakdown"
    tools:
      - "Jaeger"
      - "Tempo"
      - "AWS X-Ray"
    use_cases:
      - "Performance optimization"
      - "Service dependencies"
      - "Error propagation"
S10: Etkili uyarılar nasıl yapılandırılır?
İyi tasarlanmış uyarılar, yorgunluğu azaltır ve olaylara hızlı müdahaleyi mümkün kılar.
# prometheus-alerting-rules.yaml
# Prometheus alerting rules with best practices

groups:
  - name: application-alerts
    rules:
      # Alert on symptom, not cause
      - alert: HighErrorRate
        # Error rate > 1% over 5 minutes
        expr: |
          sum(rate(http_requests_total{status=~"5.."}[5m]))
          /
          sum(rate(http_requests_total[5m]))
          > 0.01
        for: 5m  # Avoid false positives
        labels:
          severity: critical
          team: backend
        annotations:
          summary: "High error rate detected"
          description: |
            Error rate is {{ $value | humanizePercentage }}
            for the last 5 minutes.
          runbook_url: "https://wiki.example.com/runbooks/high-error-rate"

      # Proactive alert on saturation
      - alert: DiskSpaceRunningLow
        expr: |
          (node_filesystem_avail_bytes / node_filesystem_size_bytes)
          * 100 < 20
        for: 15m
        labels:
          severity: warning
        annotations:
          summary: "Disk space below 20%"
          description: |
            Node {{ $labels.instance }} has only
            {{ $value | humanize }}% disk space remaining.

      # SLO-based alerting
      - alert: SLOBudgetBurnRate
        # Error budget consumed too quickly
        expr: |
          (
            sum(rate(http_requests_total{status=~"5.."}[1h]))
            /
            sum(rate(http_requests_total[1h]))
          ) > (1 - 0.999) * 14.4
        for: 5m
        labels:
          severity: critical
        annotations:
          summary: "SLO budget burning too fast"
          description: |
            At current error rate, monthly SLO budget will be
exhausted in less than 2 days.# alertmanager-config.yaml
# AlertManager configuration with intelligent routing
global:
resolve_timeout: 5m
route:
receiver: default
group_by: [alertname, cluster, service]
group_wait: 30s # Wait to group alerts
group_interval: 5m # Interval between grouped notifications
repeat_interval: 4h # Re-alert if not resolved
routes:
# Critical alerts: immediate notification
- match:
severity: critical
receiver: pagerduty-critical
continue: true # Also notify Slack
# Alerts by team
- match:
team: backend
receiver: slack-backend
- match:
team: infrastructure
receiver: slack-infra
receivers:
- name: pagerduty-critical
pagerduty_configs:
- service_key: <pagerduty-key>
severity: critical
- name: slack-backend
slack_configs:
- channel: '#alerts-backend'
send_resolved: true
title: '{{ .Status | toUpper }}: {{ .CommonAnnotations.summary }}'
text: '{{ .CommonAnnotations.description }}'Temel ilkeler şunlardır: nedenlere değil semptomlara (kullanıcı etkisi) göre uyarı verin, runbook'ları ekleyin ve eşik değerlerini SLO'lara göre ayarlayın.
Güvenlik ve Uyumluluk
Güvenlik soruları, risklerin ve karşı önlemlerin anlaşılmasını değerlendirir.
S11: Kubernetes kümesi nasıl güvence altına alınır?
Kubernetes güvenliği birden fazla katmanı kapsar: ağ, kimlik doğrulama, iş yükleri ve veriler.
# kubernetes-security-policies.yaml
# NetworkPolicy: network isolation between namespaces

apiVersion: networking.k8s.io/v1
kind: NetworkPolicy
metadata:
  name: default-deny-all
  namespace: production
spec:
  # Applied to all pods in namespace
  podSelector: {}
  policyTypes:
    - Ingress
    - Egress
  # No traffic allowed by default
  ingress: []
  egress: []
---
# Allow only necessary traffic
apiVersion: networking.k8s.io/v1
kind: NetworkPolicy
metadata:
  name: api-network-policy
  namespace: production
spec:
  podSelector:
    matchLabels:
      app: api
  policyTypes:
    - Ingress
    - Egress
  ingress:
    # Accept only from ingress controller
    - from:
        - namespaceSelector:
            matchLabels:
              name: ingress-nginx
      ports:
        - protocol: TCP
          port: 8080
  egress:
    # Allow to database
    - to:
        - podSelector:
            matchLabels:
              app: postgres
      ports:
        - protocol: TCP
          port: 5432
    # Allow DNS
    - to:
        - namespaceSelector: {}
          podSelector:
            matchLabels:
              k8s-app: kube-dns
      ports:
        - protocol: UDP
port: 53# pod-security-standards.yaml
# PodSecurity: workload restrictions
apiVersion: v1
kind: Namespace
metadata:
name: production
labels:
# Enforce: blocks violations
pod-security.kubernetes.io/enforce: restricted
# Warn: warns without blocking
pod-security.kubernetes.io/warn: restricted
# Audit: logs violations
pod-security.kubernetes.io/audit: restricted
---
# Pod compliant with "restricted" standards
apiVersion: v1
kind: Pod
metadata:
name: secure-pod
namespace: production
spec:
securityContext:
runAsNonRoot: true
runAsUser: 1000
fsGroup: 1000
seccompProfile:
type: RuntimeDefault
containers:
- name: app
image: myapp:latest
securityContext:
allowPrivilegeEscalation: false
readOnlyRootFilesystem: true
capabilities:
drop:
- ALL
resources:
limits:
memory: "256Mi"
cpu: "500m"
requests:
memory: "128Mi"
cpu: "250m"
volumeMounts:
- name: tmp
mountPath: /tmp
volumes:
- name: tmp
emptyDir: {}Kubernetes güvenliği birden fazla katmanı birleştirir: yetkilendirme için RBAC, ağ izolasyonu için NetworkPolicy'ler, iş yükü kısıtlamaları için PodSecurity ve beklemedeki secret'ların şifrelenmesi.
S12: En az ayrıcalık ilkesi nedir ve nasıl uygulanır?
Bu ilke, bir kullanıcının veya sistemin görevini yerine getirmek için yalnızca gerekli minimum izinlere sahip olması gerektiğini belirtir.
# rbac-least-privilege.yaml
# Kubernetes RBAC with minimal permissions

# Role: permissions in a specific namespace
apiVersion: rbac.authorization.k8s.io/v1
kind: Role
metadata:
  namespace: production
  name: deployment-manager
rules:
  # Pod reading (for monitoring)
  - apiGroups: [""]
    resources: ["pods", "pods/log"]
    verbs: ["get", "list", "watch"]
  # Deployment management only
  - apiGroups: ["apps"]
    resources: ["deployments"]
    verbs: ["get", "list", "watch", "update", "patch"]
  # No create/delete on deployments
  # No access to secrets or sensitive configmaps
---
# RoleBinding: Role <-> ServiceAccount association
apiVersion: rbac.authorization.k8s.io/v1
kind: RoleBinding
metadata:
  name: deployment-manager-binding
  namespace: production
subjects:
  - kind: ServiceAccount
    name: ci-cd-deployer
    namespace: production
roleRef:
  kind: Role
  name: deployment-manager
  apiGroup: rbac.authorization.k8s.io
---
# Dedicated ServiceAccount for CI/CD
apiVersion: v1
kind: ServiceAccount
metadata:
  name: ci-cd-deployer
  namespace: production
  annotations:
    # Automatic token expiration
    kubernetes.io/enforce-mountable-secrets: "true"
Bu ilke AWS IAM, veritabanları ve ağ erişimi için de geçerlidir.
SRE ve Güvenilirlik
SRE soruları, güvenilirlik uygulamalarının ve olay yönetiminin anlaşılmasını değerlendirir.
S13: SLO nedir ve nasıl tanımlanır?
Hizmet Düzeyi Hedefleri (SLO'lar), bir hizmetin beklenen güvenilirliğini nicelikleştirir ve mühendislik kararlarına rehberlik eder.
# slo-definitions.yaml
# SLO definitions for an API service

service: payment-api
owner: payments-team

slos:
  - name: availability
    description: "Service responds successfully to requests"
    sli:
      # SLI: measured metric
      type: availability
      good_events: "http_requests_total{status=~'2..'}"
      total_events: "http_requests_total"
    target: 99.9%  # SLO: objective
    window: 30d    # Measurement window
    # Error budget: 0.1% = 43.2 minutes/month
    error_budget:
      monthly_minutes: 43.2

  - name: latency
    description: "Response time below threshold"
    sli:
      type: latency
      good_events: "http_request_duration_seconds_bucket{le='0.3'}"
      total_events: "http_request_duration_seconds_count"
    target: 99%  # 99% of requests < 300ms
    window: 30d

  - name: throughput
    description: "Ability to process transactions"
    sli:
      type: throughput
      query: "sum(rate(transactions_processed_total[5m]))"
    target: ">= 1000 TPS"

# Actions based on error budget
error_budget_policy:
  - condition: "remaining > 50%"
    actions:
      - "Feature development prioritized"
      - "Experimentation allowed"
  - condition: "remaining 20-50%"
    actions:
      - "Balance features and reliability"
      - "Increase testing coverage"
  - condition: "remaining < 20%"
    actions:
      - "Freeze non-critical deployments"
      - "Focus on reliability improvements"
  - condition: "exhausted"
    actions:
      - "Incident response mode"
      - "All hands on reliability"
SLO'lar nesnel kararlar almayı sağlar: yeni özellik geliştirmek mi yoksa güvenilirliği güçlendirmek mi.
S14: Etkili bir post-mortem nasıl yürütülür?
Suçlamaya dayanmayan bir post-mortem, öğrenmeyi teşvik eder ve gelecekteki olayların önlenmesini destekler.
# postmortem-template.yaml
# Blameless post-mortem template

incident:
  id: "INC-2026-0042"
  title: "Payment service unavailability"
  severity: SEV1
  duration: "45 minutes"
  date: "2026-01-15"

# Factual timeline
timeline:
  - time: "14:32"
    event: "Alert: error rate > 5% on payment-api"
    actor: "PagerDuty"
  - time: "14:35"
    event: "Incident declared, team notified"
    actor: "On-call engineer"
  - time: "14:42"
    event: "Cause identified: connection pool exhausted"
    actor: "Backend team"
  - time: "14:55"
    event: "Mitigation: deployment rollback"
    actor: "Backend team"
  - time: "15:17"
    event: "Service restored, monitoring stable"
    actor: "Backend team"

# Measurable impact
impact:
  users_affected: 12500
  transactions_failed: 847
  revenue_impact: "~$16,500"
  slo_budget_consumed: "2.3 days"

# Root cause analysis (5 Whys)
root_cause_analysis:
  - question: "Why was the service unavailable?"
    answer: "DB connections were exhausted"
  - question: "Why were connections exhausted?"
    answer: "A slow query was blocking connections"
  - question: "Why was there a slow query?"
    answer: "Missing index on a new table"
  - question: "Why was the index missing?"
    answer: "Incomplete migration deployed"
  - question: "Why was the migration incomplete?"
    answer: "No execution plan validation in staging"

# Corrective actions
action_items:
  - id: "AI-001"
    type: "prevent"
    description: "Add SQL execution plan validation in CI"
    owner: "DBA team"
    due_date: "2026-01-22"
    priority: P1

  - id: "AI-002"
    type: "detect"
    description: "Alert on connection pool usage > 80%"
    owner: "SRE team"
    due_date: "2026-01-18"
    priority: P1

  - id: "AI-003"
    type: "mitigate"
    description: "Implement circuit breaker on DB queries"
    owner: "Backend team"
    due_date: "2026-01-29"
    priority: P2

# Lessons learned
lessons_learned:
  what_went_well:
    - "Fast detection thanks to alerting (< 3 min)"
    - "Clear communication in incident channel"
    - "Rollback completed in less than 15 minutes"
  what_went_poorly:
    - "No load testing on new endpoint"
    - "Staging didn't reflect prod data volume"
  lucky:
    - "Incident during daytime with full team available"
Hedef sistemi geliştirmektir, suçlanacak birini bulmak değil. Eylemler üç kategoriye ayrılır: önleme, tespit etme ve azaltma.
Pratik yapmaya başla!
Mülakat simülatörleri ve teknik testlerle bilgini test et.
Sonuç
DevOps mülakatları, kültürden teknik araçlara kadar geniş bir beceri yelpazesini kapsar. Başarının anahtarı, somut uygulama örnekleriyle desteklenmiş kavramların derinlemesine anlaşıldığını ortaya koymakta yatar.
Hazırlık kontrol listesi
- ✅ CI/CD kavramlarına hakim olun ve eksiksiz bir pipeline tasarlayabilin
- ✅ Kubernetes mimarisini anlayın ve yaygın sorunları debug edebilin
- ✅ IaC araçlarını (Terraform, Ansible) ve bunların kullanım alanlarını bilin
- ✅ İzleme yapılandırmasını ve ilgili uyarıların tanımlanmasını öğrenin
- ✅ Güvenlik en iyi uygulamalarını uygulayın (en az ayrıcalık, derinlemesine savunma)
- ✅ SRE uygulamalarını açıklayın (SLO'lar, hata bütçeleri, post-mortem'ler)
- ✅ Somut problem çözme örneklerine sahip olun
- ✅ Karmaşık kavramları sade bir dille açıklayabilin
Etiketler
Paylaş
İlgili makaleler
ArgoCD ve GitOps 2026: Kubernetes Continuous Deployment ve Mülakat Soruları
ArgoCD ve GitOps ile Kubernetes üzerinde continuous deployment rehberi. Application CRD, sync waves, ApplicationSets, ArgoCD vs Flux karşılaştırması ve DevOps mülakat soruları.

Kubernetes Mülakat Rehberi: Pods, Services ve Deployments Detaylı Anlatım
Kubernetes mülakatlarında Pods, Services ve Deployments konularında sorulan sorular -- YAML örnekleri, ağ mekanizmaları ve ölçeklendirme stratejileri ile 2026 rehberi.
Kubernetes: İlk uygulamayı dağıtma
Kubernetes üzerinde uygulama dağıtmak için pratik rehber. Minikube kurulumundan Deployment, Service ve ConfigMap'lere kadar somut örneklerle.